"In probability and statistics, a probability distribution assigns a probability to each measurable subset of the possible outcomes of a random experiment, survey, or procedure of statistical inference. Examples are found in experiments whose sample space is non-numerical, where the distribution would be a categorical distribution; experiments whose sample space is encoded by discrete random variables, where the distribution can be specified by a probability mass function; and experiments with sample spaces encoded by continuous random variables, where the distribution can be specified by a probability density function. More complex experiments, such as those involving stochastic processes defined in continuous time, may demand the use of more general probability measures." [Probability distribution. Wikipedia]
The histogram template for the ConceptDraw PRO diagramming and vector drawing software is included in the Histograms solution from the Graphs and Charts area of ConceptDraw Solution Park.
The histogram template for the ConceptDraw PRO diagramming and vector drawing software is included in the Histograms solution from the Graphs and Charts area of ConceptDraw Solution Park.
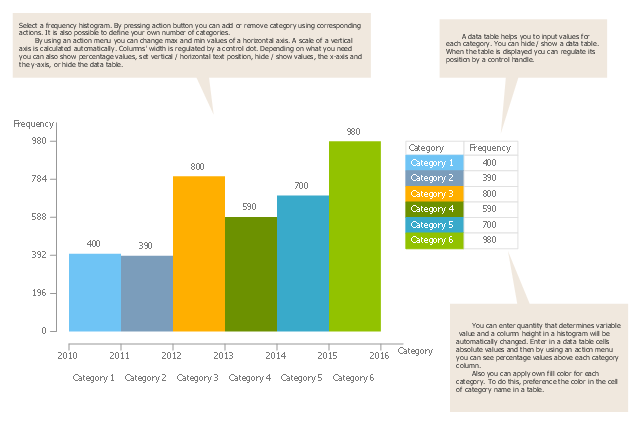
Histogram template
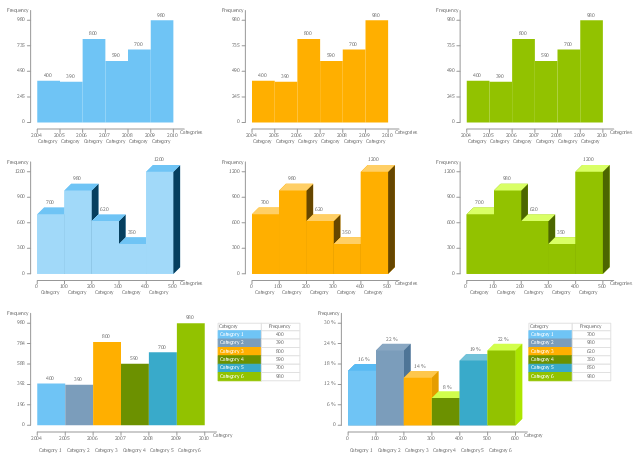
The vector stencils library "Histograms" contains 10 templates of histograms for visualizing frequency distribution data.
"In statistics, a histogram is a graphical representation of the distribution of data. It is an estimate of the probability distribution of a continuous variable...
A histogram is a representation of tabulated frequencies, shown as adjacent rectangles, erected over discrete intervals (bins), with an area equal to the frequency of the observations in the interval. The height of a rectangle is also equal to the frequency density of the interval, i.e., the frequency divided by the width of the interval. The total area of the histogram is equal to the number of data. A histogram may also be normalized displaying relative frequencies. It then shows the proportion of cases that fall into each of several categories, with the total area equaling 1. The categories are usually specified as consecutive, non-overlapping intervals of a variable. The categories (intervals) must be adjacent, and often are chosen to be of the same size. The rectangles of a histogram are drawn so that they touch each other to indicate that the original variable is continuous.
Histograms are used to plot the density of data, and often for density estimation: estimating the probability density function of the underlying variable. The total area of a histogram used for probability density is always normalized to 1." [Histogram. Wikipedia]
The example "Design elements - Histograms" was created using the ConceptDraw PRO diagramming and vector drawing software extended with the Histograms solution from the Graphs and Charts area of ConceptDraw Solution Park.
Histogram templates
 Basic Diagramming
This solution extends ConceptDraw PRO software with the specific tools you need to easily draw flowcharts, block diagrams, histograms, pie charts, divided bar diagrams, line graphs, circular arrows diagrams, Venn diagrams, bubble diagrams and concept maps
 Histograms
How to make a Histogram? Making a Histogram is an incredibly easy process when it is done with ConceptDraw PRO. The Histograms Solution enhances ConceptDraw PRO v10 functionality with extensive drawing tools, numerous samples, and examples; also a quick-start template and library of ready vector stencils for visualization the data and professional drawing Histograms.
Flyer Templates

Line Chart Template for Word

Column Chart Template

Bar Chart Template

Bar Chart Template for Word

Pie Chart Word Template. Pie Chart Examples

Spider Chart Template

 ConceptDraw Solution Park
ConceptDraw Solution Park collects graphic extensions, examples and learning materials
Donut Chart Templates

Form Maker

 Graphs and Charts Area
Solutions from the Graphs and Charts Area of ConceptDraw Solution Park collect templates, samples and libraries of vector stencils for visualization of numerical data.
Chart Templates

Line Chart Templates

Basic Diagramming


Pie Chart Examples and Templates

- Design elements - Histograms | Histogram template | Design ...
- Histogram template | Frequency histogram - Page load time | Chart ...
- Histograms | Design elements - Histograms | Histogram template |
- Histograms | Chart Examples | Black cherry tree histogram |
- Histograms | Chart Examples | Visual Presentations Made Easy with ...
- Histograms | Chart Examples | Bar Chart Examples |
- Step chart template | Basic Diagramming | The Best Drawing ...
- Best Multi-Platform Diagram Software | The Best Drawing Program ...
- Histograms | Black cherry tree histogram |
- The Best Drawing Program for Mac | Best Software to Draw ...
- Simple Diagramming | Simple Drawing Applications for Mac | Visual ...
- Sales Dashboard Template | Europe spatial dashboard template ...
- Chart Examples | Projects HR dashboard | Column Chart Examples |
- The Best Drawing Program for Mac | The Best Choice for Creating ...
- HR dashboard | Projects HR dashboard | Employee dashboard |
- Frequency distribution charts
- Employee dashboard | Frequency Distribution Dashboard | HR ...
- IDEF0 Diagrams | PM Easy | Histograms |
- The Best Flowchart Software Available | Visual Presentations Made ...
- Bar Chart Software | Sales Growth. Bar Graphs Example | Column ...