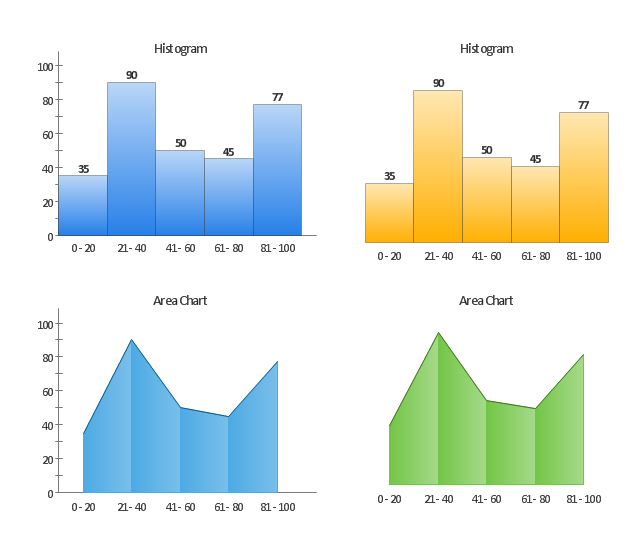
The vector stencils library "Frequency distribution charts" contains 2 area chart templates and 2 histogram templates.
Frequency distribution charts are Live Objects which show the distribution of items within numerical ranges.
Use this library for drawing visual dashboards in the ConceptDraw PRO diagramming and vector drawing software extended with the Frequency Distribution Dashboard solution from the area "What is a Dashboard" of ConceptDraw Solution Park.
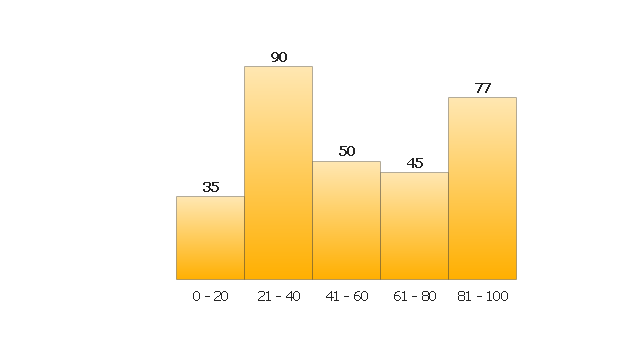
Histogram 1

Histogram 2
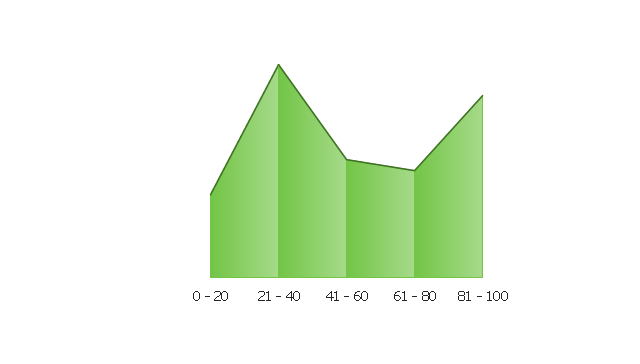
Area Chart 1
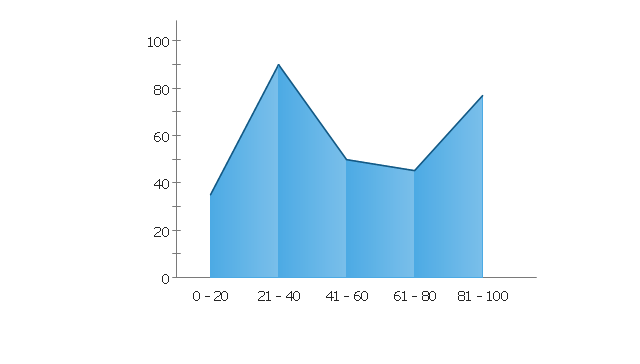
Area Chart 2
Data Source File Example
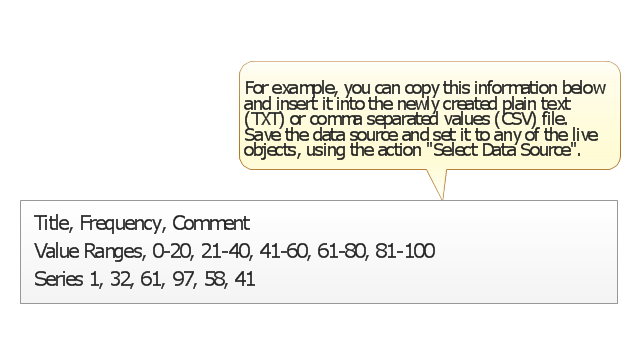
The vector stencils library "Frequency distribution charts" contains 4 Live Objects: two templates of histograms and two templates of area charts. The ConceptDraw Live Objects are ready-to-use templates of charts and visual indicators for dashboard design. You can set data source file for Each Live Object, and your charts or indicators will represents actual data from the data source files, and change their appearance with changing of the data in source files.
Use the design elements library "Frequency distribution charts" to create your own business visual dashboards using the ConceptDraw PRO diagramming and vector drawing software.
The example "Design elements - Frequency distribution charts" is included in the Frequency Distribution Dashboard solution from the area "What is a Dashboard" of ConceptDraw Solution Park.
Frequency distribution charts
 Frequency Distribution Dashboard
Frequency distribution dashboard solution extends ConceptDraw PRO software with samples, templates and vector stencils libraries with histograms and area charts for drawing the visual dashboards showing frequency distribution of data.
 Histograms
How to make a Histogram? Making a Histogram is an incredibly easy process when it is done with ConceptDraw PRO. The Histograms Solution enhances ConceptDraw PRO v10 functionality with extensive drawing tools, numerous samples, and examples; also a quick-start template and library of ready vector stencils for visualization the data and professional drawing Histograms.
 What is a Dashboard Area
Solutions from the area What is a Dashboard of ConceptDraw Solution Park collects templates, samples and vector stencils libraries with of data driven charts and indicators for drawing the basic types of Visual Dashboards.
 Seven Basic Tools of Quality
Manage quality control in the workplace, using fishbone diagrams, flowcharts, Pareto charts and histograms, provided by the Seven Basic Tools of Quality solution.
Competitor Analysis

 Basic Histograms
This solution extends the capabilities of ConceptDraw PRO v10.3.0 (or later) with templates, samples and a library of vector stencils for drawing Histograms.
 USA Maps
Use the USA Maps solution to create a map of USA, a US interstate map, printable US maps, US maps with cities and US maps with capitals. Create a complete USA states map.
 Cross-Functional Flowcharts
Cross-functional flowcharts are powerful and useful tool for visualizing and analyzing complex business processes which requires involvement of multiple people, teams or even departments. They let clearly represent a sequence of the process steps, the order of operations, relationships between processes and responsible functional units (such as departments or positions).
 Audit Flowcharts
Audit flowcharts solution extends ConceptDraw PRO software with templates, samples and library of vector stencils for drawing the audit and fiscal flow charts.
 Seven Management and Planning Tools
Seven Management and Planning Tools solution extends ConceptDraw PRO and ConceptDraw MINDMAP with features, templates, samples and libraries of vector stencils for drawing management mind maps and diagrams.
 Basic Pie Charts
This solution extends the capabilities of ConceptDraw PRO v10.3.0 (or later) with templates, samples, and a library of vector stencils for drawing pie and donut charts.
- Design elements - Frequency distribution charts
- Frequency Distribution Flow Chart
- Frequency Distribution Dashboard | Flowchart Marketing Process ...
- Frequency Distribution Dashboard | Flow chart Example ...
- Frequency Distribution Dashboard | Pie Charts | Competitor Analysis ...
- Frequency Distribution Dashboard | Cisco Network Diagrams | Flow ...
- Frequency Distribution Dashboard | Flow chart Example ...
- Frequency distribution charts - Vector stencils library
- Flow chart Example. Warehouse Flowchart | Frequency Distribution ...
- Chart For Distribution Network For Food Products
- Frequency Distribution Dashboard | Cisco Network Diagrams ...
- Cisco Network Diagrams | Frequency Distribution Dashboard | Flow ...
- Frequency Distribution Dashboard | ConceptDraw Solution Park ...
- Activity Network Diagram Method | Frequency Distribution ...
- Flow chart Example. Warehouse Flowchart | Frequency Distribution ...
- Employee distribution - HR dashboard | HR dashboard | Frequency ...
- Flow chart Example. Warehouse Flowchart | Frequency Distribution ...
- Frequency Distribution Dashboard | Network Diagramming with ...
- Normal distribution | Interior Design Storage and Distribution ...
- Frequency Distribution Dashboard | Cross-Functional Flowcharts ...
- ERD | Entity Relationship Diagrams, ERD Software for Mac and Win
- Flowchart | Basic Flowchart Symbols and Meaning
- Flowchart | Flowchart Design - Symbols, Shapes, Stencils and Icons
- Flowchart | Flow Chart Symbols
- Electrical | Electrical Drawing - Wiring and Circuits Schematics
- Flowchart | Common Flowchart Symbols
- Flowchart | Common Flowchart Symbols