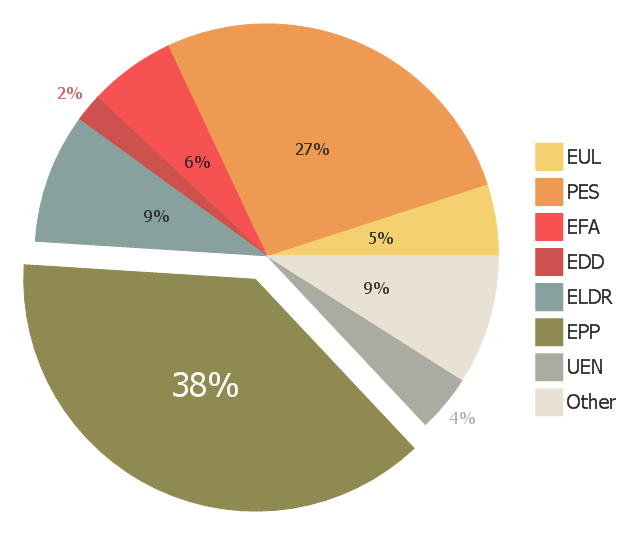
This exploded pie chart example shows the ''preliminary'' results from the 2004 European Parliament election. It was designed on the base of the Wikimedia Commons file: Pie chart EP election 2004 exploded.png. [commons.wikimedia.org/ wiki/ File:Pie_ chart_ EP_ election_ 2004_ exploded.png].
This file is available under the Creative Commons Attribution-ShareAlike 3.0 Unported License. [creativecommons.org/ licenses/ by-sa/ 3.0/ ].
"Elections to the European Parliament take place every five years by universal adult suffrage. 751 MEPs (Members of the European Parliament) are elected to the European Parliament which has been directly elected since 1979. No other EU institution is directly elected, with the Council of the European Union and the European Council being only indirectly legitimated through national elections. While Europarties have the right to campaign EU-wide for the European elections, campaigns are still taking place through national election campaigns, advertising national delegates from national parties." [Elections to the European Parliament. Wikipedia]
The exploded pie chart example "European Parliament election" was created using the ConceptDraw PRO diagramming and vector drawing software extended with the Pie Charts solution of the Graphs and Charts area in ConceptDraw Solution Park.
Exploded pie chart
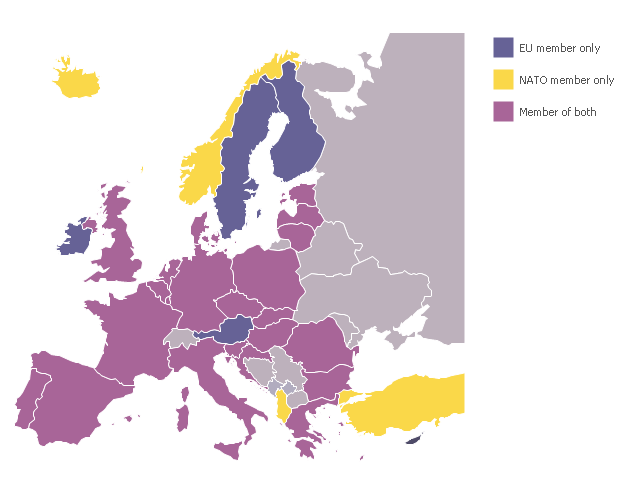
A map showing European membership of the EU and NATO.
"The European Union (EU) is an economic and political union of 28 member states that are located primarily in Europe.
The EU operates through a system of supranational independent institutions and intergovernmental negotiated decisions by the member states. Institutions of the EU include the European Commission, the Council of the European Union, the European Council, the Court of Justice of the European Union, the European Central Bank, the Court of Auditors, and the European Parliament. The European Parliament is elected every five years by EU citizens. The EU's de facto capital is Brussels." [European Union. Wikipedia]
"The principal military alliance in Europe remains NATO, which includes 21 of all EU member states as well as other non-EU European countries, Turkey, the United States and Canada." [Military of the European Union. Wikipedia]
"The North Atlantic Treaty Organization (NATO), also called the (North) Atlantic Alliance, is an intergovernmental military alliance based on the North Atlantic Treaty which was signed on 4 April 1949. The organization constitutes a system of collective defence whereby its member states agree to mutual defense in response to an attack by any external party. NATO's headquarters are in Brussels, Belgium, one of the 28 member states across North America and Europe, the newest of which, Albania and Croatia, joined in April 2009." [NATO. Wikipedia]
This Europe map example was redesigned using the ConceptDraw PRO diagramming and vector drawing software from the Wikimedia Commons file: EU and NATO.svg.
[commons.wikimedia.org/ wiki/ File:EU_ and_ NATO.svg]
The Europe political map example "European membership of the EU and NATO map" is included in the Continent Maps solution from the Maps area of ConceptDraw Solution Park.
Political map - EU and NATO
Pie Chart Examples and Templates

Pie chart examples and templates created using ConceptDraw PRO software helps you get closer with pie charts and find pie chart examples suite your needs.
Chart Examples

Chart Templates

 Pie Charts
Pie Charts are extensively used in statistics and business for explaining data and work results, in mass media for comparison (i.e. to visualize the percentage for the parts of one total), and in many other fields. The Pie Charts solution for ConceptDraw PRO v10 offers powerful drawing tools, varied templates, samples, and a library of vector stencils for simple construction and design of Pie Charts, Donut Chart, and Pie Graph Worksheets.
Donut Chart Templates

All these donut chart templates are included in the Pie Charts solution.
You can quickly rework these examples into your own charts by simply changing displayed data, title and legend texts.
- European Parliament election | Exploded pie chart - European ...
- European Parliament election - Exploded pie chart | European ...
- Exploded pie chart - European Parliament election | European ...
- Exploded pie chart (percentage) - Template
- Exploded pie chart - European Parliament election | Organizational ...
- Exploded pie chart - European Parliament election | Europe browser ...
- European Parliament election | Relative Value Chart Software | How ...
- Pie Chart Examples and Templates | Exploded pie chart - European ...
- European Parliament election
- European membership of the EU and NATO map | Exploded pie ...
- Bar Graphs | Bar Diagrams for Problem Solving. Create economics ...
- Geo Map - Europe | Geo Map - Europe - Austria | European ...
- European membership of the EU and NATO map | Political map of ...
- Political map of Europe | Geo Map - Europe - Germany | European ...
- European membership of the EU and NATO map | EU 28: Candidate ...
- World Continents Map | Political map of Europe | European ...
- European membership of the EU and NATO map | Continent Maps ...
- EU 28: Candidate countries map | European membership of the EU ...
- European membership of the EU and NATO map | World Continents ...
- Bar Chart Of Parliament
- ERD | Entity Relationship Diagrams, ERD Software for Mac and Win
- Flowchart | Basic Flowchart Symbols and Meaning
- Flowchart | Flowchart Design - Symbols, Shapes, Stencils and Icons
- Flowchart | Flow Chart Symbols
- Electrical | Electrical Drawing - Wiring and Circuits Schematics
- Flowchart | Common Flowchart Symbols
- Flowchart | Common Flowchart Symbols