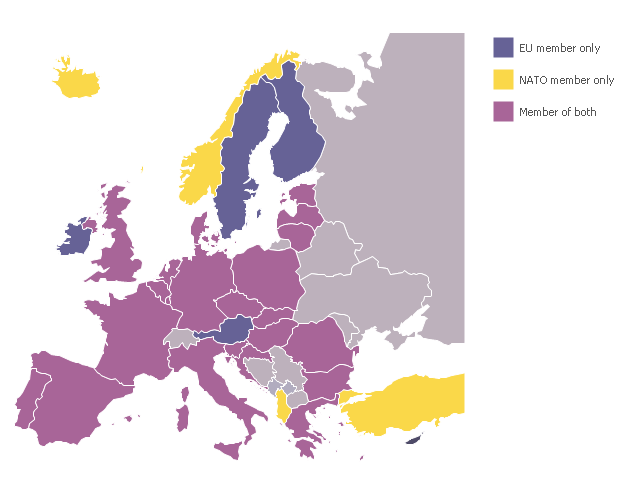
A map showing European membership of the EU and NATO.
"The European Union (EU) is an economic and political union of 28 member states that are located primarily in Europe.
The EU operates through a system of supranational independent institutions and intergovernmental negotiated decisions by the member states. Institutions of the EU include the European Commission, the Council of the European Union, the European Council, the Court of Justice of the European Union, the European Central Bank, the Court of Auditors, and the European Parliament. The European Parliament is elected every five years by EU citizens. The EU's de facto capital is Brussels." [European Union. Wikipedia]
"The principal military alliance in Europe remains NATO, which includes 21 of all EU member states as well as other non-EU European countries, Turkey, the United States and Canada." [Military of the European Union. Wikipedia]
"The North Atlantic Treaty Organization (NATO), also called the (North) Atlantic Alliance, is an intergovernmental military alliance based on the North Atlantic Treaty which was signed on 4 April 1949. The organization constitutes a system of collective defence whereby its member states agree to mutual defense in response to an attack by any external party. NATO's headquarters are in Brussels, Belgium, one of the 28 member states across North America and Europe, the newest of which, Albania and Croatia, joined in April 2009." [NATO. Wikipedia]
This Europe map example was redesigned using the ConceptDraw PRO diagramming and vector drawing software from the Wikimedia Commons file: EU and NATO.svg.
[commons.wikimedia.org/ wiki/ File:EU_ and_ NATO.svg]
The Europe political map example "European membership of the EU and NATO map" is included in the Continent Maps solution from the Maps area of ConceptDraw Solution Park.
Political map - EU and NATO
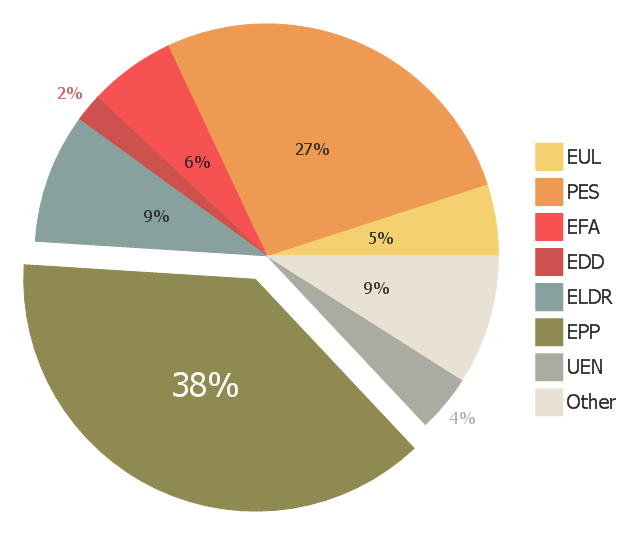
The exploded pie chart example "European Parliament election" was redesigned from the Wikipedia file: Pie_ chart_ EP_ election_ 2004_ exploded.png [en.wikipedia.org/ wiki/ File:Pie_ chart_ EP_ election_ 2004_ exploded.png ].
This file is available under the Creative Commons Attribution-ShareAlike 3.0 Unported License [creativecommons.org/ licenses/ by-sa/ 3.0/ ].
"Elections to the European Parliament take place every five years by universal adult suffrage. 751 MEPs (Members of the European Parliament) are elected to the European Parliament which has been directly elected since 1979. No other EU institution is directly elected, with the Council of the European Union and the European Council being only indirectly legitimated through national elections. While Europarties have the right to campaign EU-wide for the European elections, campaigns are still taking place through national election campaigns, advertising national delegates from national parties." [Elections to the European Parliament. Wikipedia]
"A chart with one or more sectors separated from the rest of the disk is known as an exploded pie chart. This effect is used to either highlight a sector, or to highlight smaller segments of the chart with small proportions." [Pie chart. Wikipedia]
The exploded pie chart example "European Parliament election" was created using the ConceptDraw PRO diagramming and vector drawing software extended with the Pie Charts solution of the Graphs and Charts area in ConceptDraw Solution Park.
www.conceptdraw.com/ solution-park/ charts-pie
Exploded pie chart

This exploded pie chart example shows the ''preliminary'' results from the 2004 European Parliament election. It was designed on the base of the Wikimedia Commons file: Pie chart EP election 2004 exploded.png. [commons.wikimedia.org/ wiki/ File:Pie_ chart_ EP_ election_ 2004_ exploded.png].
This file is available under the Creative Commons Attribution-ShareAlike 3.0 Unported License. [creativecommons.org/ licenses/ by-sa/ 3.0/ ].
"Elections to the European Parliament take place every five years by universal adult suffrage. 751 MEPs (Members of the European Parliament) are elected to the European Parliament which has been directly elected since 1979. No other EU institution is directly elected, with the Council of the European Union and the European Council being only indirectly legitimated through national elections. While Europarties have the right to campaign EU-wide for the European elections, campaigns are still taking place through national election campaigns, advertising national delegates from national parties." [Elections to the European Parliament. Wikipedia]
The exploded pie chart example "European Parliament election" was created using the ConceptDraw PRO diagramming and vector drawing software extended with the Pie Charts solution of the Graphs and Charts area in ConceptDraw Solution Park.
Exploded pie chart
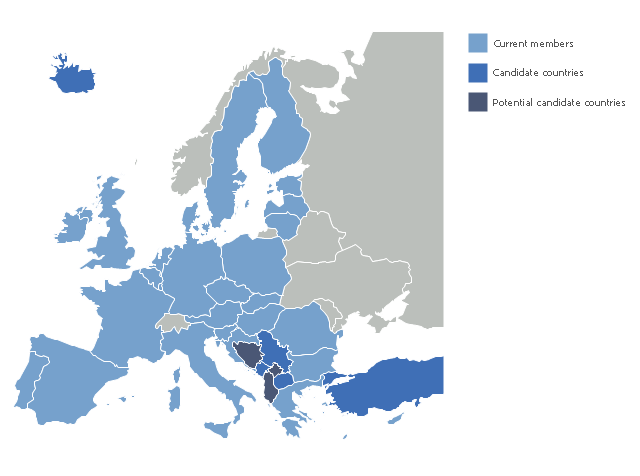
"The 2013 enlargement of the European Union saw Croatia join the European Union as their 28th member state on 1 July 2013.
Croatia is the second former Yugoslav republic to join the European Union after a decade-long negotiation process. The country applied for EU membership in 2003, and the European Commission recommended making it an official candidate in early 2004. Candidate country status was granted to Croatia by the European Council in mid-2004. The entry negotiations, while originally set for March 2005, began in October that year together with the screening process." [2013 enlargement of the European Union. Wikipedia]
This Europe map example was redesigned using ConceptDraw PRO diagramming and vector drawing software from the Wikimedia Commons file: EU28-candidate countries map.svg.
[commons.wikimedia.org/ wiki/ File:EU28-candidate_ countries_ map.svg]
The Europe political map example "EU 28: Candidate countries map" is included in the Continent Maps solution from the Maps area of ConceptDraw Solution Park.
Political map - European Union
Geo Map - Europe - Poland

Geo Map - Europe - Belgium

 Continent Maps
Continent Maps solution extends ConceptDraw PRO software with templates, samples and libraries of vector stencils for drawing the thematic maps of continents, state maps of USA and Australia.
Registered unemployment rate in Europe (EU-27) - september 2010. Data from Portal Euro-Indicators on EU Commission website (Eurostat). [epp.eurostat.ec.europa.eu/ portal/ page/ portal/ euroindicators/ peeis]
"Eurostat, the statistical office of the European Union, defines unemployed as those persons age 15 to 74 who are not working, have looked for work in the last four weeks, and ready to start work within two weeks, which conform to ILO standards. Both the actual count and rate of unemployment are reported. Statistical data are available by member state, for the European Union as a whole (EU27) as well as for the euro area (EA16). Eurostat also includes a long-term unemployment rate. This is defined as part of the unemployed who have been unemployed for an excess of 1 year.
The main source used is the European Union Labour Force Survey (EU-LFS). The EU-LFS collects data on all member states each quarter. For monthly calculations, national surveys or national registers from employment offices are used in conjunction with quarterly EU-LFS data. The exact calculation for individual countries, resulting in harmonized monthly data, depend on the availability of the data." [Unemployment. Wikipedia]
This example Registered unemployment rate in Europe (EU-27) - september 2010 was redesigned from the Wikimedia Commons file: Unemployment European Union 2010M09.svg.
[commons.wikimedia.org/ wiki/ File:Unemployment_ European_ Union_ 2010M09.svg]
This file is licensed under the Creative Commons Attribution-Share Alike 3.0 Unported license. [creativecommons.org/ licenses/ by-sa/ 3.0/ deed.en]
The thematic map example "Registered unemployment rate in Europe (EU-27) - september 2010" was created using the ConceptDraw PRO diagramming and vector drawing software extended with the Continent Map solution from the Maps area of ConceptDraw Solution Park.
Thematic map - European Union
---september-2010.png--diagram-flowchart-example.png)
The vector stencils library "Marketing maps" contains 44 state map contours with capitals and major cities: the Group of Twenty (G20) state maps, EU state maps and World map.
Use it to visualize geospatial information in your marketing infograms.
"The Group of Twenty (also known as the G-20 or G20) is a forum for the governments and central bank governors from 20 major economies. The members, shown highlighted on the map at right, include 19 individual countries—Argentina, Australia, Brazil, Canada, China, France, Germany, India, Indonesia, Italy, Japan, Republic of Korea, Mexico, Russian Federation, Saudi Arabia, South Africa, Turkey, United Kingdom, United States—and the European Union (EU). The EU is represented by the European Commission and by the ECB." [G-20 major economies. Wikipedia]
The G-20 state map contours example "Design elements - Marketing maps (G-20)" was created using the ConceptDraw PRO diagramming and vector drawing software extended with the Marketing Infographics solition from the area "Business Infographics" in ConceptDraw Solution Park.
The Group of Twenty (G-20) state maps
-state-maps-design-elements---marketing-maps-(g-20).png--diagram-flowchart-example.png)
The vector stencils library "Education maps" contains 44 state map contours with capitals and major cities: G-20 state maps, EU state maps and world map.
Use it to visualize geospatial information in your education infograms.
"The European Union (EU) is a politico-economic union of 28 member states that are primarily located in Europe: Austria, Belgium, Bulgaria, Croatia, Cyprus, Czech Republic, Denmark, Estonia, Finland, France, Germany, Greece, Hungary, Ireland, Italy, Latvia, Lithuania, Luxembourg, Malta, Netherlands, Poland, Portugal, Romania, Slovakia, Slovenia, Spain, Sweden, United Kingdom." [European Union. Wikipedia]
The European Union map contours example "Design elements - Education maps (EU)" was created using the ConceptDraw PRO diagramming and vector drawing software extended with the Education Infographics solition from the area "Business Infographics" in ConceptDraw Solution Park.
European Union state map contours
.png--diagram-flowchart-example.png)
Maps of Germany

Geo Map - Europe - Slovenia

Tools to Create Your Own Infographics

- Geo Map - Asia - Papua New Guinea | Geo Map - Europe - Bulgaria ...
- Geo Map - Europe - Bulgaria | Geo Map - Asia - Papua New Guinea ...
- European Parliament election - Exploded pie chart | European ...
- Maps Of Countries
- Exploded pie chart - European Parliament election | Organizational ...
- European membership of the EU and NATO map | EU 28: Candidate ...
- Exploded pie chart - European Parliament election | European ...
- European Parliament election | Exploded pie chart - European ...
- Political map of Central America | World Continents Map | Maghreb ...
- Geo Map - Europe - Netherlands | Map of South America - The ...
- Exploded pie chart - European Parliament election | Europe browser ...
- Exploded pie chart (percentage) - Template
- Exploded pie chart - European Parliament election | Pie Graph ...
- Exploded pie chart - European Parliament election | European ...
- Europe Vector Png
- European membership of the EU and NATO map | Design elements ...
- Exploded pie chart - European Parliament election | European ...
- Geo Map - Europe
- Headquarter Png
- Geo Map - Europe