Geo Map - Europe

Geo Map - Europe - Bulgaria

Registered unemployment rate in Europe (EU-27) - september 2010. Data from Portal Euro-Indicators on EU Commission website (Eurostat). [epp.eurostat.ec.europa.eu/ portal/ page/ portal/ euroindicators/ peeis]
"Eurostat, the statistical office of the European Union, defines unemployed as those persons age 15 to 74 who are not working, have looked for work in the last four weeks, and ready to start work within two weeks, which conform to ILO standards. Both the actual count and rate of unemployment are reported. Statistical data are available by member state, for the European Union as a whole (EU27) as well as for the euro area (EA16). Eurostat also includes a long-term unemployment rate. This is defined as part of the unemployed who have been unemployed for an excess of 1 year.
The main source used is the European Union Labour Force Survey (EU-LFS). The EU-LFS collects data on all member states each quarter. For monthly calculations, national surveys or national registers from employment offices are used in conjunction with quarterly EU-LFS data. The exact calculation for individual countries, resulting in harmonized monthly data, depend on the availability of the data." [Unemployment. Wikipedia]
This example Registered unemployment rate in Europe (EU-27) - september 2010 was redesigned from the Wikimedia Commons file: Unemployment European Union 2010M09.svg.
[commons.wikimedia.org/ wiki/ File:Unemployment_ European_ Union_ 2010M09.svg]
This file is licensed under the Creative Commons Attribution-Share Alike 3.0 Unported license. [creativecommons.org/ licenses/ by-sa/ 3.0/ deed.en]
The thematic map example "Registered unemployment rate in Europe (EU-27) - september 2010" was created using the ConceptDraw PRO diagramming and vector drawing software extended with the Continent Map solution from the Maps area of ConceptDraw Solution Park.
Thematic map - European Union
---september-2010.png--diagram-flowchart-example.png)
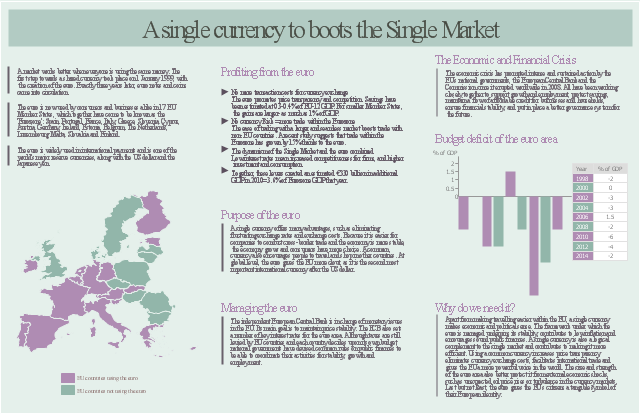
The marketing infogram example "A single currency to boots the Single Market" was created on the base of data from the webpages:
(1) "20 YEARS
of the European
Single Market" from the website of the European Commission. [ec.europa.eu/ internal_ market/ publications/ docs/ 20years/ achievements-web_ en.pdf]
(2) "The euro" from the website of the European Union.
[europa.eu/ about-eu/ basic-information/ money/ euro/ index_ en.htm]
(3) "The euro" from the website of the European Commission. [ec.europa.eu/ economy_ finance/ euro/ index_ en.htm]
(4) "Euro" from Wikipedia. [en.wikipedia.org/ wiki/ Euro]
"A single market is a type of trade bloc which is composed of a free trade area (for goods) with some common policies on product regulation, and freedom of movement of the factors of production (capital and labour) and of enterprise and services. The goal is that the movement of capital, labour, goods, and services between the members is as easy as within them. The physical (borders), technical (standards) and fiscal (taxes) barriers among the member states are removed to the maximum extent possible. These barriers obstruct the freedom of movement of the four factors of production." [Single market. Wikipedia]
The marketing infographic example "A single currency to boots the Single Market" was created using the ConceptDraw PRO diagramming and vector drawing software extended with the Marketing Infographics solition from the area "Business Infographics" in ConceptDraw Solution Park.
Marketing infogram
This line chart sample depicts data from the European Economic Forecast (EUROPEAN ECONOMY 1|2013, Economic and Financial Affairs Winter 2013, European Commission).
[ec.europa.eu/ economy_ finance/ publications/ european_ economy/ 2013/ pdf/ ee1_ en.pdf]
"Exports in France decreased to 36526 EUR Million in October of 2013 from 36637 EUR Million in September of 2013. Exports in France is reported by the Ministère de l'Économie et des Finances. Exports in France averaged 17102.29 EUR Million from 1970 until 2013, reaching an all time high of 37964 EUR Million in August of 2012 and a record low of 1165.60 EUR Million in May of 1970. France is one of the largest exporters of luxury goods and agricultural products in the world. France main exports are: aircrafts (10.1 percent of total exports), food (9.7 percent), chemicals (9.5 percent), industrial machinery (8.3 percent), iron and steel (7.9 percent), electronics (6.7 percent), motor vehicles (6.3 percent) and pharmaceuticals (6.1 percent). Trade outflows to Europe account for 70 percent of total exports. Main export partners are: Germany (16.6 percent of total exports), Italy (8.2 percent), Spain (7.3 percent), Belgium (7.2 percent), the United Kingdom (6.6 percent), the United States (5.6 percent), Netherlands and China. This page contains - France Exports - actual values, historical data, forecast, chart, statistics, economic calendar and news." [tradingeconomics.com/ france/ exports]
The line graph example "France exports of goods and services" was created using ConceptDraw PRO diagramming and vector drawing software extended with Line Graphs solution from Graphs and Charts area of ConceptDraw Solution Park.
Line chart

"SWOT analysis is an analytical method which is used to identify and categorise significant internal (Strengths and Weaknesses) and external (Opportunities and Threats) factors faced either in a particular arena, such as an organisation, or a territory, such as a region, nation, or city.
It provides information that is helpful in matching the firms' resources and capabilities to the competitive environment in which it operates and is therefore an important contribution to the strategic planning process.
It should not be viewed as a static method with emphasis solely on its output, but should be used as a dynamic part of the management and business development process." [forlearn.jrc.ec.europa.eu/ guide/ 4_ methodology/ meth_ swot-analysis.htm]
This SWOT analysis matrix diagram example was created using the ConceptDraw PRO diagramming and vector drawing software extended with the SWOT Analysis solution from the Management area of ConceptDraw Solution Park.
SWOT matrix

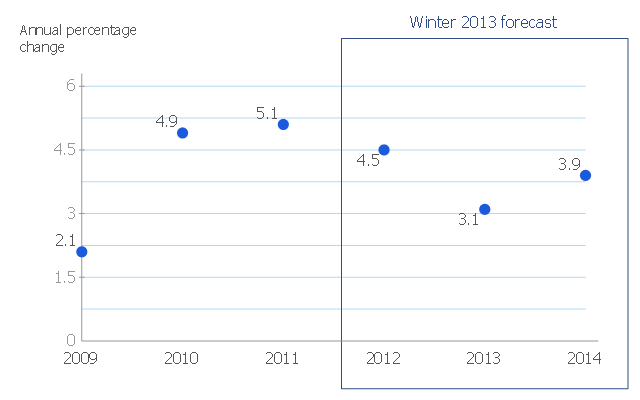
This scatter chart sample shows the MENA's (Middle East and North Africa's) real GDP growth. It was designed on the base scatter graph from the website of the European Economic Forecast (EUROPEAN ECONOMY 1|2013, Economic and Financial Affairs Winter 2013, European Commission). [ec.europa.eu/ economy_ finance/ publications/ european_ economy/ 2013/ pdf/ ee1_ en.pdf]
"The term MENA, for "Middle East and North Africa", is an acronym often used in academic, military planning, disaster relief, and business writing.
Due to the geographic ambiguity and Eurocentric nature of the term "Middle East", many people prefer use of the term WANA (West Asia and North Africa) or the less common NAWA (North Africa-West Asia).
The term covers an extensive region, extending from Morocco to Iran, including the majority of both the Middle Eastern and Maghreb countries. The term is roughly synonymous with the term the Greater Middle East. ...
MENA has no standardized definition; different organizations define the region as consisting of different territories. The following is a list of commonly included countries and territories: Bahrain, Egypt, Iran, Iraq, Israel, Jordan, Kuwait, Lebanon, Yemen, United Arab Emirates, Libya, Morocco, Oman, West Bank and Gaza, Qatar, Saudi Arabia, Syria, Tunisia, Algeria.
Sometimes also included in broader definitions: Armenia, Azerbaijan, Cyprus, Djibouti, Mauritania, Somalia, Sudan, Turkey, Western Sahara." [MENA. Wikipedia]
The scatter chart example "Middle East and North Africa's real GDP growth" was created using the ConceptDraw PRO diagramming and vector drawing software extended with the Line Graphs solution from the Graphs and Charts area of ConceptDraw Solution Park.
Scatter graph
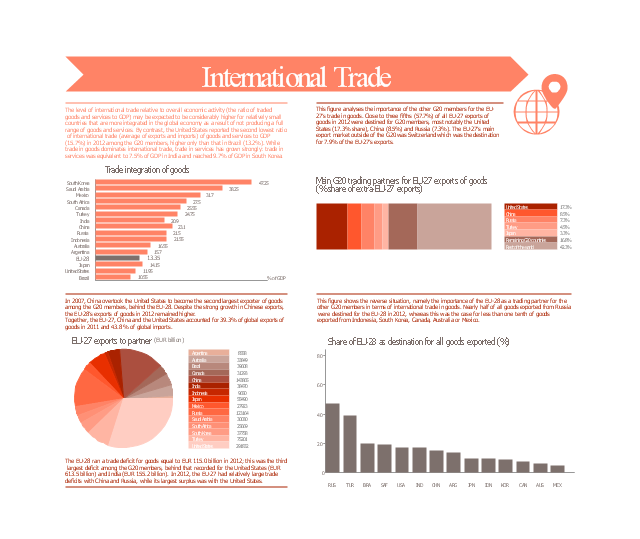
This marketing infogram example was created on the base of data of "The EU in the world 2014. A statistical portrai" from the website of the Eurostat - the statistical office of the European Union situated in Luxembourg.
"In 2007, China overtook the United States to become the second largest exporter of goods among the G20 members, behind the EU-28. Despite the strong growth in Chinese exports, the EU-28’s exports of goods in 2012 remained higher.
Together, the EU-27, China and the United States accounted for 39.3% of global exports of goods in 2011 and 43.8 % of global imports."
[epp.eurostat.ec.europa.eu/ cache/ ITY_ OFFPUB/ KS-EX-14-001/ EN/ KS-EX-14-001-EN.PDF]
The marketing infographic example "International trade statistics - EU in comparison with the Group of Twenty" was created using the ConceptDraw PRO diagramming and vector drawing software extended with the Marketing Infographics solition from the area "Business Infographics" in ConceptDraw Solution Park.
Marketing infogram
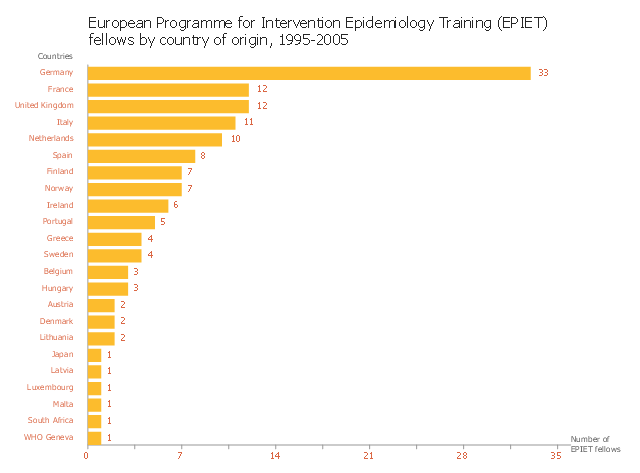
This horizontal bar graph sample shows distribution of European Programme for Intervention Epidemiology Training (EPIET) fellows by country of origin in 1995-2005. It was designed on the base of the bar chart from the website of the Field Epidemiology Manual (FEM) Wiki, the European Programme for Intervention Epidemiology Training (EPIET).
"The simplest bar graph displays data from a table with one variable. Each bar represents one category. Bar graphs can be organised horizontally or vertically. Vertical bars differ from histograms since they are separated by a space. The height of the bar is proportional to the number of events (e.g. cases) in the category, nevertheless the surface is not always proportional to the width of the category on the x-axis (e.g. different width of age groups). If there is a logical order between categories it should be respected. Otherwise categories can be organised along decreasing or increasing values of respective bars. Variables in a bar graph can be discrete (e.g. sex, region, race) or continuous (e.g. age) but organised in categories (e.g. age groups). The x axis does not need to be continuous." [wiki.ecdc.europa.eu/ fem/ w/ wiki/ bar-graphs]
The bar chart example "EPIET fellows by country of origin" was created using the ConceptDraw PRO diagramming and vector drawing software extended with the Bar Graphs solution from the Graphs and Charts area of ConceptDraw Solution Park.
Bar chart
- Png Of Continent Europe
- Geo Map - Europe - Romania
- South Asia - Political map | Thematic maps - Vector stencils library ...
- Ecosystem goods and services - Segmented pyramid diagram ...
- Geo Map - Europe - France | Geo Map - South America - French ...
- 3D Column chart - Iran internet users per 100 person | Column Chart ...
- Middle East - Political map | Geo Map - Asia | MENA's (Middle East ...
- West Africa countries | Geo Map - Africa | Middle East and North ...
- Example Of Europe
- Design Map Europa
- Percent of Students achieved a 36 on ACT | Percentage of the top 1 ...
- Geo Map - Asia - Turkey | Asia - Vector stencils library | European ...
- Number of airlines departures in the given years - Line chart ...
- Line Chart Examples | Line Graph Charting Software | Chart ...
- Chart Examples | Line Chart Examples | France exports of goods ...
- European membership of the EU and NATO map | EU 28: Candidate ...
- East Africa - Political map
- Service-goods continuum diagram | Ecosystem goods and services ...
- Chart Examples | Line Chart Examples | Bar Graphs | Percentage Vs ...
- Six Markets Model Chart | Market value - Pyramid diagram | Market ...