Tools to Create Your Own Infographics
Infographics
There are two systems that determine the way a person processes information: subconscious and conscious. Subconsious system operates continuously and requires no human intervention, while conscious functions require direct participation. For example, if a person sees a picture, which will depicts someone happy, this person will need a very little time and almost no effort to understand that. That is an example of subliminal perception system. In the next place, if a person sees an image of any logical equation, then he would need some efforts to solve it, which is an example of a conscious system work. Based on this, the main task of data visualization is in presenting the information in a way that the greater part of it would be perceived subconsciously. To achieve such efficiency, one should try to encode data in different visual attributes such as color, shape, size and various shapes as much as possible. It is very important to understand the information that requires visualization. A designer can create a creative and vibrant bar graph or chart that will be meaningless if he does not understand the essence of what he needs to show. Data visualization is used to display a particular information, or to emphasize something. So, in the first place, it is important to analyze the data, and only then to use the illustration tools. There are several common data visual encodings with varying accuracy of comparison. Thus, line and bar charts, for example, are considered the most accurate and color differentiation and pie charts provide a lower level of comparison accuracy.
ConceptDraw DIAGRAMis a software for create your own infographics with more than 10 library objects that scalable vector images. The Spatial Infographics solution is an additional libraries of vector graphic stencils for drawing simple infographical presentation of numerical data. ConceptDraw DIAGRAM allows you to focus on work, not the drawing process.

Sample 1. Europe map - Spatial infographics template.
Solution Spatial Infographics from ConceptDraw Solution Park extends ConceptDraw DIAGRAM ector diagramming and business graphics software with easy-to-use spatial infographics drawing tools.
This solution contains spatial infographics samples, map templates to be filled in, and libraries of vector stencils for main design elements of spatial infographics.
Use this solution to draw your own geospatial infographics documents with thematic maps, road maps, directional maps and transport maps.
TEN RELATED HOW TO's:
South America includes 12 sovereign states.
ConceptDraw DIAGRAM is idea to draw the geological maps of South America continent from the pre-designed vector geo map shapes.
Use Continent Maps solution from the Maps area of ConceptDraw Solution Park to draw thematic maps, geospatial infographics and vector illustrations for your business documents, presentations and websites.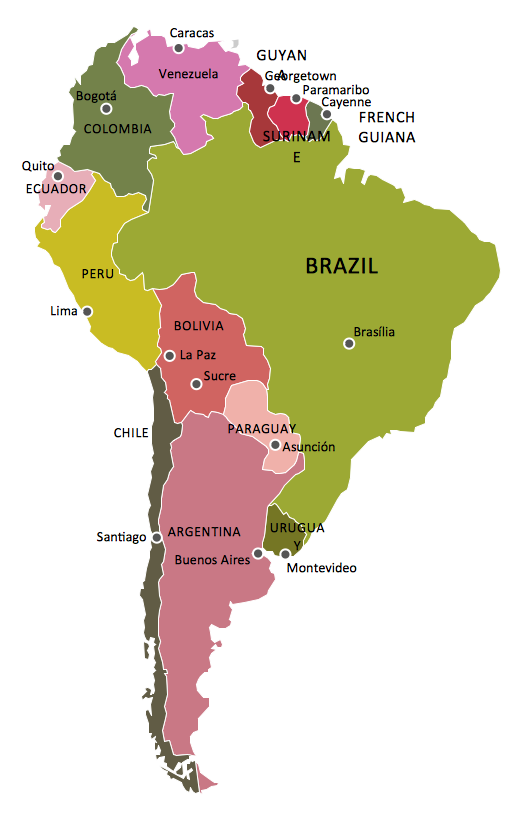
Picture: Geo Map — South America Continent
Related Solution:
As restaurant industry is growing rapidly nowadays, researches show that almost half of the adults have worked in a restaurant or a cafe. Moreover, many of them dream to start their own someday. Unfortunately, it takes a lot of time to write a business plan and to find a great location, although some know how to create a restaurant floor plan in minutes or how to plan budget effortlessly. Hiring employees can also cause a lot of headache, but this is crucial for further success, because every guest comes to restaurant for a good service and delicious food. It is also worth noting that restaurant concept is also important, because it defines target audience and influences the menu.
This diagram represents the floor plan of an ongoing sports-theme establishment - restaurant, cafe, or other food service. A number of widescreen monitors installed along the perimeter provide visitors the opportunity to follow the course of a match from anywhere in the dining room of restaurant or cafe. The most of sports fans believe that food and alcohol is a big part of any sports show. That is why the dining room takes the most space - almost 60% of the total establishment space. Nearly all sports fans consume beverages while watching sports - beer, soda or water at least. Thus, the restaurant floor plan designers added a large lavatory there. Moreover, project developers considered unnecessary the gender division of such delicate place - perhaps they guess that only men are watching football, or believe that alcohol will eliminate the most of gender differences.
Picture: How To Create Restaurant Floor Plan in Minutes
Related Solution:
The Education Infographics are popular and effectively applied in the educational process. Now you don't need to be an artist to design colorful pictorial education infographics thanks to the unique drawing tools of Education Infographics Solution for ConceptDraw DIAGRAM diagramming and vector drawing software.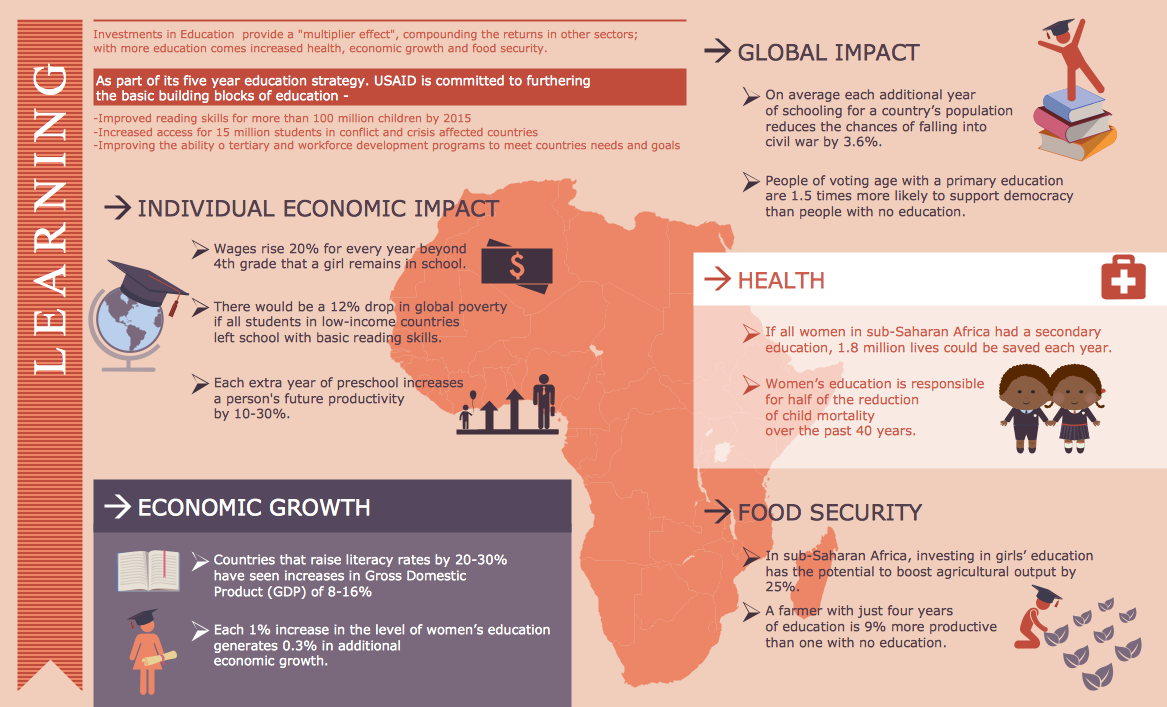
Picture: Education Infographics
Related Solution:
An example of marketing analysis diagram, can be used to analyse product market and define marketing strategy.
This sample shows the Feature Comparison Chart of the digital scouting cameras. It can be useful for digital cameras production field, marketing, sales, etc.
Picture: Feature Comparison Chart Software
Related Solution:
The Philippines, officially known as the Republic of the Philippines, is a sovereign island country in Southeast Asia situated in the western Pacific Ocean.
Use the Continent Maps solution and Philippines library to draw thematic maps, geospatial infographics and vector illustrations. This solution to help visualize the business and thematic information connected with geographic areas, locations or customs; for your business documents, presentations and websites.
Picture: Geo Map - Asia - Philippines
Related Solution:
When studying a business process or system involving the transfer of data, it is common to use a Data Flow Diagram (DFD) to visualize how data are processed. Being initially used exclusively in regards to the flow of data through a computer system, now DFDs are employed as the business modeling tools. They are applied to describe the business events and interactions, or physical systems involving data storage and transfer. ConceptDraw DIAGRAM is a powerful Data Flow Diagram software thanks to the Data Flow Diagrams solution from the Software Development area of ConceptDraw Solution Park.
Picture: Data Flow Diagram Software
Related Solution:
Any hierarchical structure of any company can be represented as a triangle or a pyramid. You can create a pyramid diagram and pyramid chart of any complexity using special libraries included in ConceptDraw DIAGRAM. Actually, any knowledge or chain of facts can also be depicted as a pyramid.
A wide range of graph and chart are utilized in marketing to maintain documentation and various visual issues, that deal with marketing information and data. The marketing value pyramid can be created to illustrate how the value of company, or product is based on its competitiveness. To design this diagram we used ConceptDraw DIAGRAM drawing tools in conjunction with Pyramid solution for Solution Park.
Picture: Pyramid Diagram and Pyramid Chart
Related Solutions:
Create a Line Chart with ConceptDraw using our tips. Here you can find an explanation of how to create a line chart quickly.
Picture: How to Create a Line Chart
Related Solution:
Infographic is a visual way of representing various information, data, knowledge in statistics, geography, journalism, education, and much more areas. ConceptDraw DIAGRAM supplied with Pictorial Infographics Solution from the “Infographics” Area, provides a set of powerful pictorial infographics tools. Thanks to them it is the best Infographic Maker.
Picture: Infographic Maker
Related Solution:
Any factory needs a clear scheme of all the equipment used in the manufacture processes. So, if you want to place all your machines and equipment on one diagram, you need a good diagramming tool for that. For instance, you can find all the design elements you might need, such as lathes, milling machines or saws on ConceptDraw DIAGRAM Solution Park in Plant Layout Plans solution in appropriate libraries.
This drawing represents the Machines and Equipment library delivered by ConceptDraw Plant Layout Plans solution. This vector library is supplied along with other libraries related to industrial architecture planning and interior design.
Just planning the proper facilities in a proper right place, allows to manufacture a product in the most effective and economic way. Objects containing in these libraries will be helpful for architects and engineers dealing with industrial buildings design. They are intended to use for designing layouts of plants, warehouses, manufacturing workshop etc.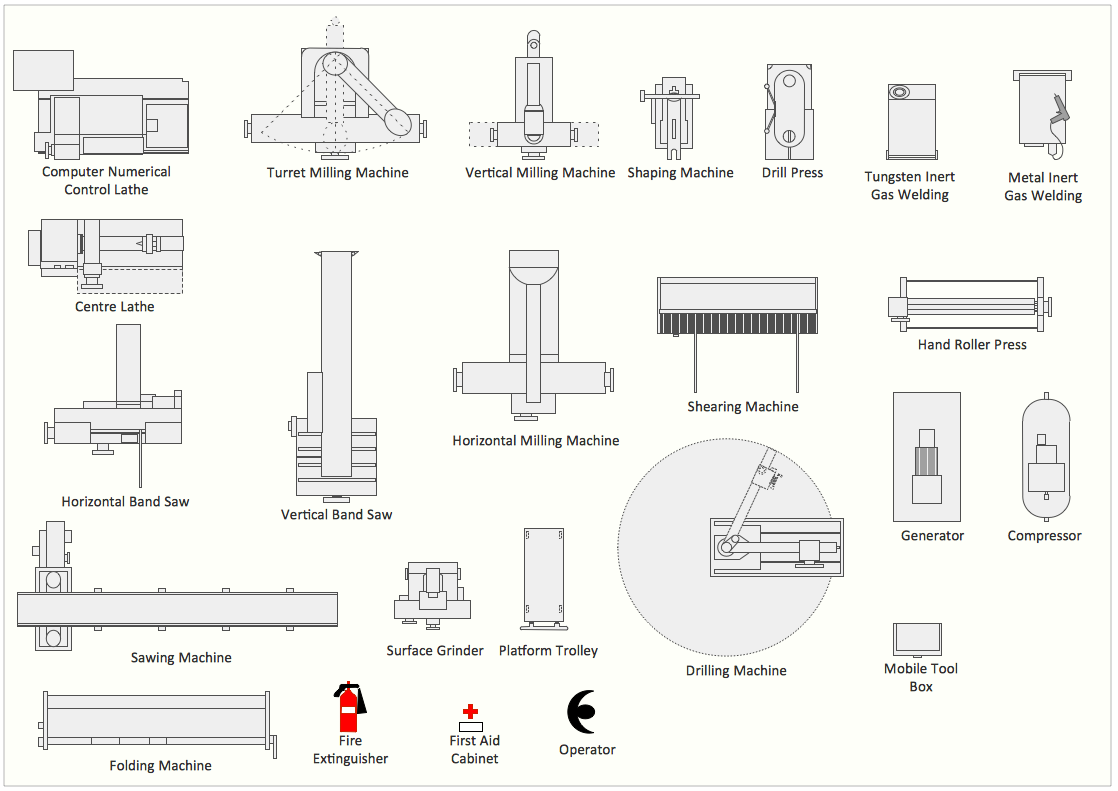
Picture: Interior Design. Machines and Equipment — Design Elements
Related Solution: