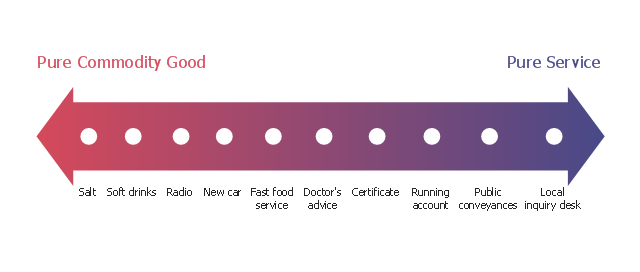
This marketing diagram sample depicts service-goods continuum.
"The dichotomy between physical goods and intangible services is an oversimplification; these are not discrete categories. Most business theorists see a continuum with pure service at one endpoint and pure commodity goods at the other endpoint. Most products fall between these two extremes. Goods are normally structural and can be transferred in an instant while services are delivered over a period of time. Goods can be returned while a service once delivered cannot. Goods are not always tangible and may be virtual." [Goods and services. Wikipedia]
The marketing chart example "Service-goods continuum diagram" was created using the ConceptDraw PRO diagramming and vector drawing software extended with the Marketing Diagrams solution from the Marketing area of ConceptDraw Solution Park.
Marketing chart
The vector stencils library "Marketing diagrams" contains 12 templates of marketing and sales diagrams and charts. Use it to illustrate your marketing and sales documents, presentations, infographics and webpages in ConceptDraw PRO software extended with Marketing Diagrams solution from Marketing area of ConceptDraw Solution Park.
Diffusion of Innovations

Normal distribution

Five forces model

Leaky bucket diagram

Funnel diagram

Relationship ladder of customer loyalty

Six markets model

Product life cycle graph

Extended product life cycle graph

Service-goods continuum diagram

Step chart block

Step diagram block

The vector stencils library "Marketing diagrams" contains 12 templates of marketing and sales diagrams and charts. Use it to illustrate your marketing and sales documents, presentations, infographics and webpages in ConceptDraw PRO software extended with Marketing Diagrams solution from Marketing area of ConceptDraw Solution Park.
Diffusion of Innovations
Normal distribution
Five forces model
Leaky bucket diagram
Funnel diagram
Relationship ladder of customer loyalty
Six markets model
Product life cycle graph
Extended product life cycle graph
Service-goods continuum diagram
Step chart block
Step diagram block
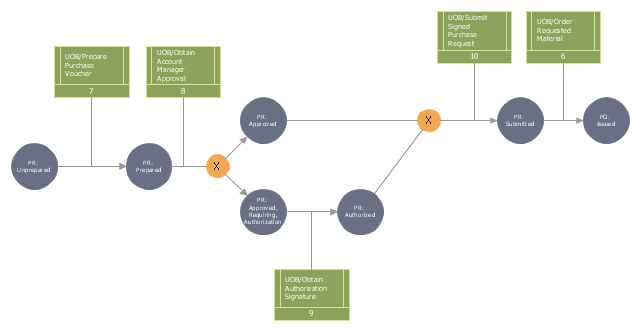
This IDEF3 diagram example was redesigned from the Wikimedia Commons file: 2-02 Example of a Transition Schematic.jpg.
[commons.wikimedia.org/ wiki/ File:2-02_ Example_ of_ a_ Transition_ Schematic.jpg]
"The schematic in Figure 2-2 represents an Object Schematic for the Order Material scenario derived from the business owner’s description. This example happens to illustrate a Transition Schematic since it characterizes the nature and structure of object state transitions for occurrences of the Order Material scenario. A key document in this process is the Purchase Request form. This form is eventually transformed into a Purchase Order (PO) via the Order Material process. A circle containing the name of an object represents an object of a certain kind (e.g., Purchase Request, Account Manager, Project). These labeled circles are known as kind symbols. A certain kind of object being in a certain state is represented by a circle with a label that captures both the kind itself and a corresponding state, thereby representing the type (or class) of objects that are in that state (within a given process). ... One of the first steps to develop an Object Schematic is to identify the possible states in which the object can exist. Though a real-world object often evolves through a continuum of states, an Object Schematic focuses on those distinguished states of particular interest to the domain expert. The transition arcs (arrows with triangular, filled-in heads) connecting the circles symbolize a state transition, the activity of changing from one state to another. The conditions that establish when an object is in a given state, how it exists a state, how it can transition between states, and how it can enter a new state are recorded on a special form. The banded boxes linked to the arrows (called referents) are aids to describe the relationships between objects states and UOBs, scenarios, or other Transition Schematics that participate in a scenario occurrence. ... The transition junctions containing an “X” (for exclusive or) indicate the choice of exactly one path among several possible paths in an occurrence." [IDEF3 Process Description Capture Method Report AL-TR-1995-XXXX. idef.com/ pdf/ Idef3_ fn.pdf]
The diagram "Transition schematic - IDEF3 diagram example" was created using the ConceptDraw PRO diagramming and vector drawing software extended with the solution "IDEF Business Process Diagrams" from the area "Business Processes" of ConceptDraw Solution Park.
IDEF3 business process diagram
The vector stencils library "Marketing diagrams" contains 12 templates of marketing and sales diagrams and charts. Use it to illustrate your marketing and sales documents, presentations, infographics and webpages in ConceptDraw PRO software extended with Marketing Diagrams solution from Marketing area of ConceptDraw Solution Park.
Diffusion of Innovations
Normal distribution
Five forces model
Leaky bucket diagram
Funnel diagram
Relationship ladder of customer loyalty
Six markets model
Product life cycle graph
Extended product life cycle graph
Service-goods continuum diagram
Step chart block
Step diagram block
Pyramid Diagram

Pyramid Diagram

 Marketing Diagrams
Marketing Diagrams solution extends ConceptDraw DIAGRAM diagramming software with abundance of samples, templates and vector design elements intended for easy graphical visualization and drawing different types of Marketing diagrams and graphs, including Branding Strategies Diagram, Five Forces Model Diagram, Decision Tree Diagram, Puzzle Diagram, Step Diagram, Process Chart, Strategy Map, Funnel Diagram, Value Chain Diagram, Ladder of Customer Loyalty Diagram, Leaky Bucket Diagram, Promotional Mix Diagram, Service-Goods Continuum Diagram, Six Markets Model Diagram, Sources of Customer Satisfaction Diagram, etc. Analyze effectively the marketing activity of your company and apply the optimal marketing methods with ConceptDraw DIAGRAM software.
- Service-goods continuum diagram | Product Service Continuum ...
- Service-goods continuum diagram | Explain Good Service Continuum
- Service-goods continuum diagram | Marketing Diagrams | Pyramid ...
- Service-goods continuum diagram | Marketing Diagrams | Leaky ...
- Service-goods continuum diagram | Meaning Of Goods Services ...
- Service-goods continuum diagram | Marketing Diagrams | Marketing ...
- Service-goods continuum diagram | Providing telecom services ...
- Service-goods continuum diagram | Marketing Diagrams | Process ...
- Service-goods continuum diagram | Marketing diagrams - Vector ...
- Service-goods continuum diagram | Pyramid Diagram | Marketing ...
- Service-goods continuum diagram | Process Flowchart | Marketing ...
- Service-goods continuum diagram | Leadership and data - Circle ...
- Service-goods continuum diagram | France exports of goods and ...
- Service-goods continuum diagram | Marketing Diagrams | Marketing ...
- Service-goods continuum diagram | Pyramid Chart Examples ...
- Service-goods continuum diagram
- Service-goods continuum diagram | AWS Architecture Diagrams ...
- Service-goods continuum diagram | Explain Concept Of Good ...
- Pyramid Chart Examples | Service-goods continuum diagram ...
- Continuum Diagram Template
- ERD | Entity Relationship Diagrams, ERD Software for Mac and Win
- Flowchart | Basic Flowchart Symbols and Meaning
- Flowchart | Flowchart Design - Symbols, Shapes, Stencils and Icons
- Flowchart | Flow Chart Symbols
- Electrical | Electrical Drawing - Wiring and Circuits Schematics
- Flowchart | Common Flowchart Symbols
- Flowchart | Common Flowchart Symbols