This site uses cookies. By continuing to browse the ConceptDraw site you are agreeing to our Use of Site Cookies.
HelpDesk

How to Add a Bubble Diagram to PowerPoint Presentation

Bubble diagrams can be used to compare concepts and identify areas of similarity and difference. ConceptDraw DIAGRAM allows you to make an MS PowerPoint Presentation from your charts in a few simple steps. A bubble diagram is a chart that represents information visually in the form of a series of bubbles. Bubble charts are often used in marketing and management during the early stages of product development to visualize ideas and concepts by organizing them in a hierarchy. The ability to create this form of a diagram is contained within the Bubble Diagrams solution. A PowerPoint presentation of bubble diagrams can be used to demonstrate and identify areas of similarity and difference of featured business ideas and concepts.

How to Create Presentation of Your Project Gantt Chart

During the planning, discussing and execution of a project you may need to prepare a presentation using project views such as the Gantt Chart, Multiproject Dashboard or Resource Usage View. It’s easy do with ConceptDraw PROJECT!

Organizational Chart Templates

ConceptDraw offers you a number of ready-made organizational chart templates which you can use in your drawing. They are grouped in topical sets as organizational chart template files.
Use the Organizational Charts Solution for ConceptDraw DIAGRAM to create your own Organizational Charts of any complexity quick, easy and effective.
The Organizational Charts designed with ConceptDraw DIAGRAM are vector graphic documents and are available for reviewing, modifying, converting to a variety of formats (image, HTML, PDF file, MS PowerPoint Presentation, Adobe Flash or MS Visio XML), printing and send via e-mail in one moment.
How to draw an Organizational Chart
HelpDesk

How to Add a Cross-Functional Flowchart to a PowerPoint Presentation

Using a Cross-Functional flowchart is a clear way of showing how business processes get shared or transferred between different teams and departments. ConceptDraw DIAGRAM allows you to make an MS PowerPoint Presentation from your flowcharts in a few simple steps.

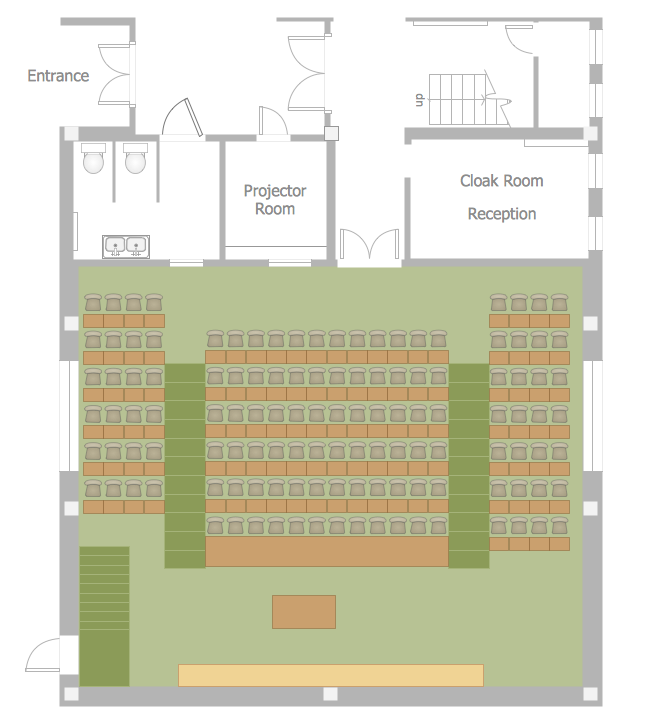
Classroom Seating Chart Template

ConceptDraw DIAGRAM diagramming and vector drawing software offers the School and Training Plans Solution from the Building Plans Area with extensive drawing tools, predesigned vector shapes and samples which are convenient for using as is or as classroom seating chart template.
HelpDesk

How to Add a Block Diagram to a PowerPoint Presentation

Block diagram is a rather universal type of charts - compositions from geometric blocks can be applied to describe various kinds of processes or systems, consisting of components, which depend on each other. Block diagrams are indispensable when you need to represent a processor system on a basic level. With blocks, you can easily depict the basic elements of the process, without drilling down. The PowerPoint presentation of major process steps and key process participants can be very informative and helpful. Using ConceptDraw DIAGRAM, you can easily convert a block diagram to an MS PowerPoint presentation.
HelpDesk

How To Add a Computer Network Diagram to a PowerPoint Presentation

The PowerPoint presentation of the computer network can be very informative. ConceptDraw DIAGRAM allows you to easily create computer network diagrams and then make a PowerPoint Presentation from your network diagrams in a single click.

Chart Maker for Presentations

Easy charting software comes with beautiful chart templates and examples. This makes it easy to create professional charts without prior experience.
HelpDesk

How to Add a Circle-spoke Diagram to PowerPoint

ConceptDraw DIAGRAM can be used as a tool for creating circle spoke diagrams along with other marketing diagrams. ConceptDraw DIAGRAM allows you to make an MS PowerPoint Presentation from your marketing diagrams in a few simple steps.
HelpDesk

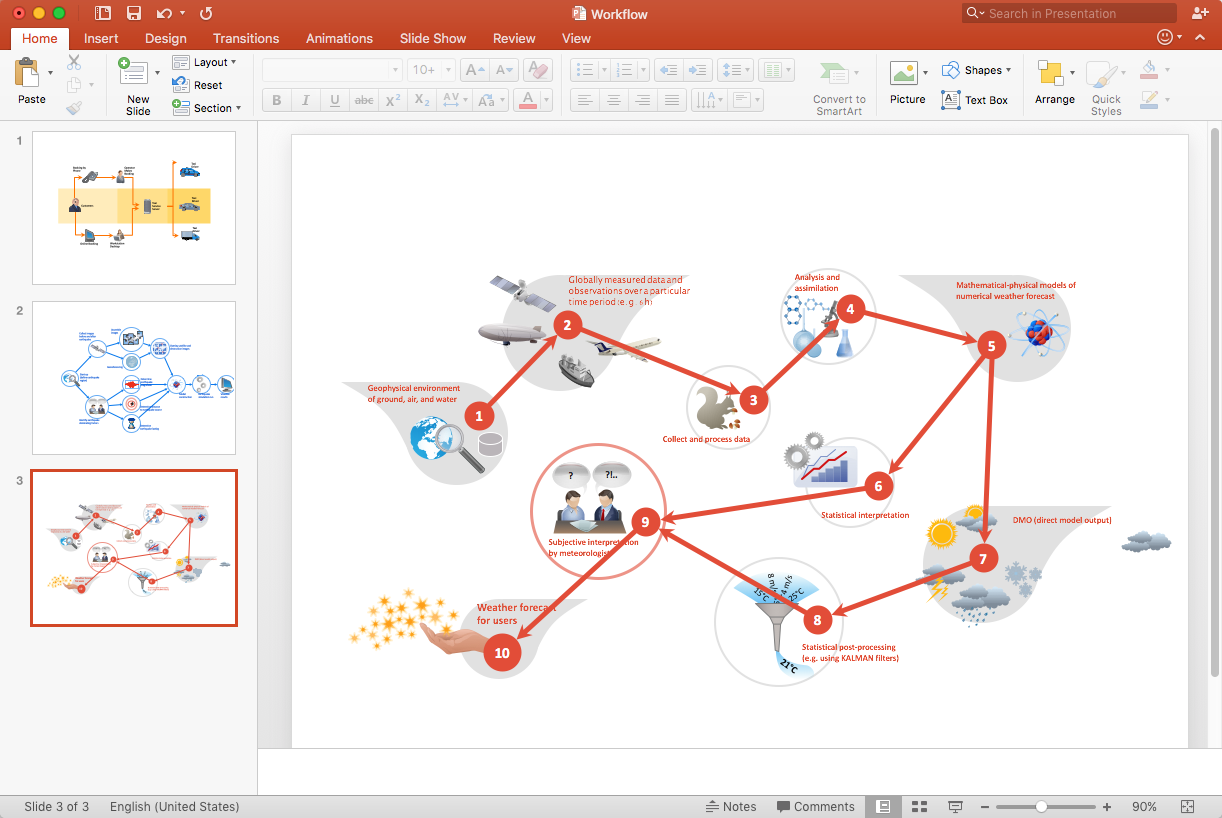
How to Add a Workflow Diagram to a PowerPoint Presentation

Making workflow diagrams in PowerPoint can help to describe the process within your organization as well as making comprehensive analysis presentations for sales or management and also can be used in other presentations and business documentation.