SDL Diagram
This sample was created in ConceptDraw DIAGRAM vector drawing software using the Basic Diagramming Solution from the Universal Diagramming area of ConceptDraw Solution Park.
Specification and Description Language (SDL) is used for creating the object-oriented diagrams, visualizing the processes of the state machines for the systems of communication, telecommunication, automotive, aviation and medical industries. SDL is a specification language for creating specifications, descriptions of the behavior, data, and inheritance for real-time systems.
For creating the SDL diagrams are used the building blocks such as: system definition, block agent, process.
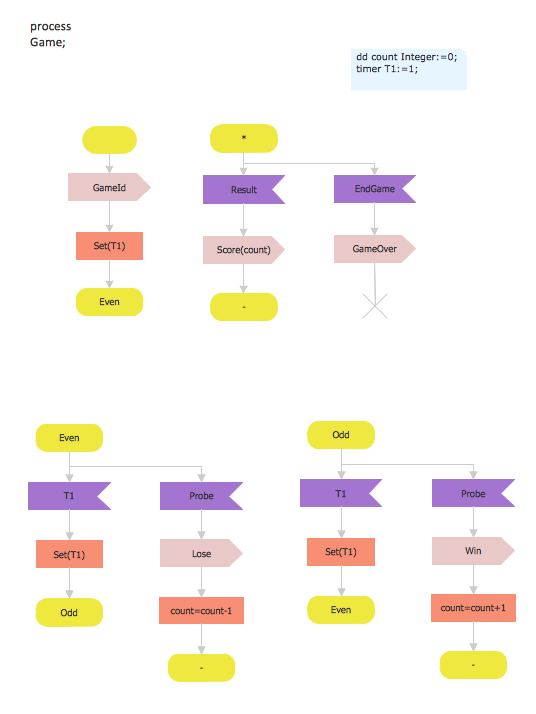
Sample 1. SDL process game.
This sample shows the SDL Diagram of the process game.
Use the ready-to-use predesigned objects, templates and samples from the Basic Diagramming Solution for ConceptDraw DIAGRAM you can create your own SDL Diagrams quick and easy.
The SDL Diagrams produced with ConceptDraw DIAGRAM are vector graphic documents and are available for reviewing, modifying, and converting to a variety of formats (image, HTML, PDF file, MS PowerPoint Presentation, Adobe Flash or MS Visio).
TEN RELATED HOW TO's:
Interactive tool helps you find the appropriate response to social media mentions quickly.
Picture: How to Use the ″Online Store PR Campaign″ Sample
Related Solution:
This template was created in ConceptDraw DIAGRAM diagramming and vector drawing software using the Block Diagrams Solution from the “Diagrams” area of ConceptDraw Solution Park.
This template shows the Product Proposal Diagram on that is displayed the sequence of the product planning steps. This diagram is convenient, visual and clear.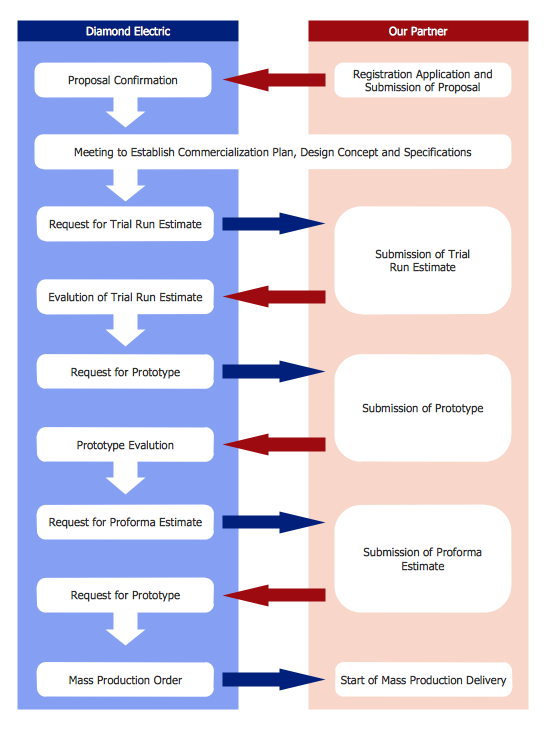
Picture: Product Proposal Template
Related Solution:
Diagrams are a very important part of modern life. With the help of flow diagram software, a lot of companies can promote their ideas at the market. Its usefulness is totally doubtless.
This is a flow chart of the invoice payment flow. This flowchart details decrypts all stages of the process of obtaining and paying bills. It is a description of the universal process - such steps performs accounting departments of almost any organization. Since every business no matter what it does is a consumer of some goods or services. The given flow chart was made using ConceptDraw DIAGRAM software and the Diagrams solution for making flowcharts of any kind.
Picture: Flow Diagram Software
Related Solution:
You need design a Bank UML Diagram? Now, thanks to the ConceptDraw DIAGRAM diagramming and vector drawing software extended with ATM UML Diagrams Solution from the Software Development Area, you can design without efforts any type of Bank UML Diagram you want - Class, Activity, Communication, Component, Composite structure, Deployment, Interaction overview, Object, Package, Profile, Sequence, State machine, Timing, Use case.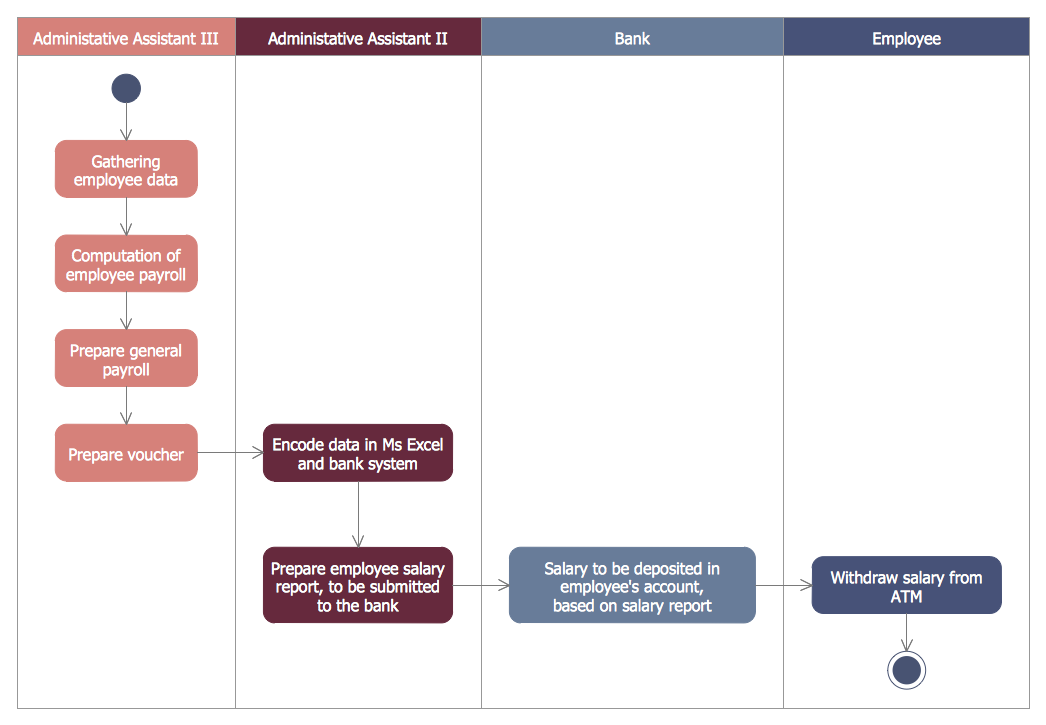
Picture: Bank UML Diagram
Related Solution:
The UML diagrams in this Solution are divided into three broad categories: Structure Diagrams; Behavior Diagrams; Interaction Diagrams.
The 13 diagrams contained in the Rapid UML Solution offer an essential framework for systems analysts and software architects to create the diagrams they need to model processes from the conceptual level on through to project completion.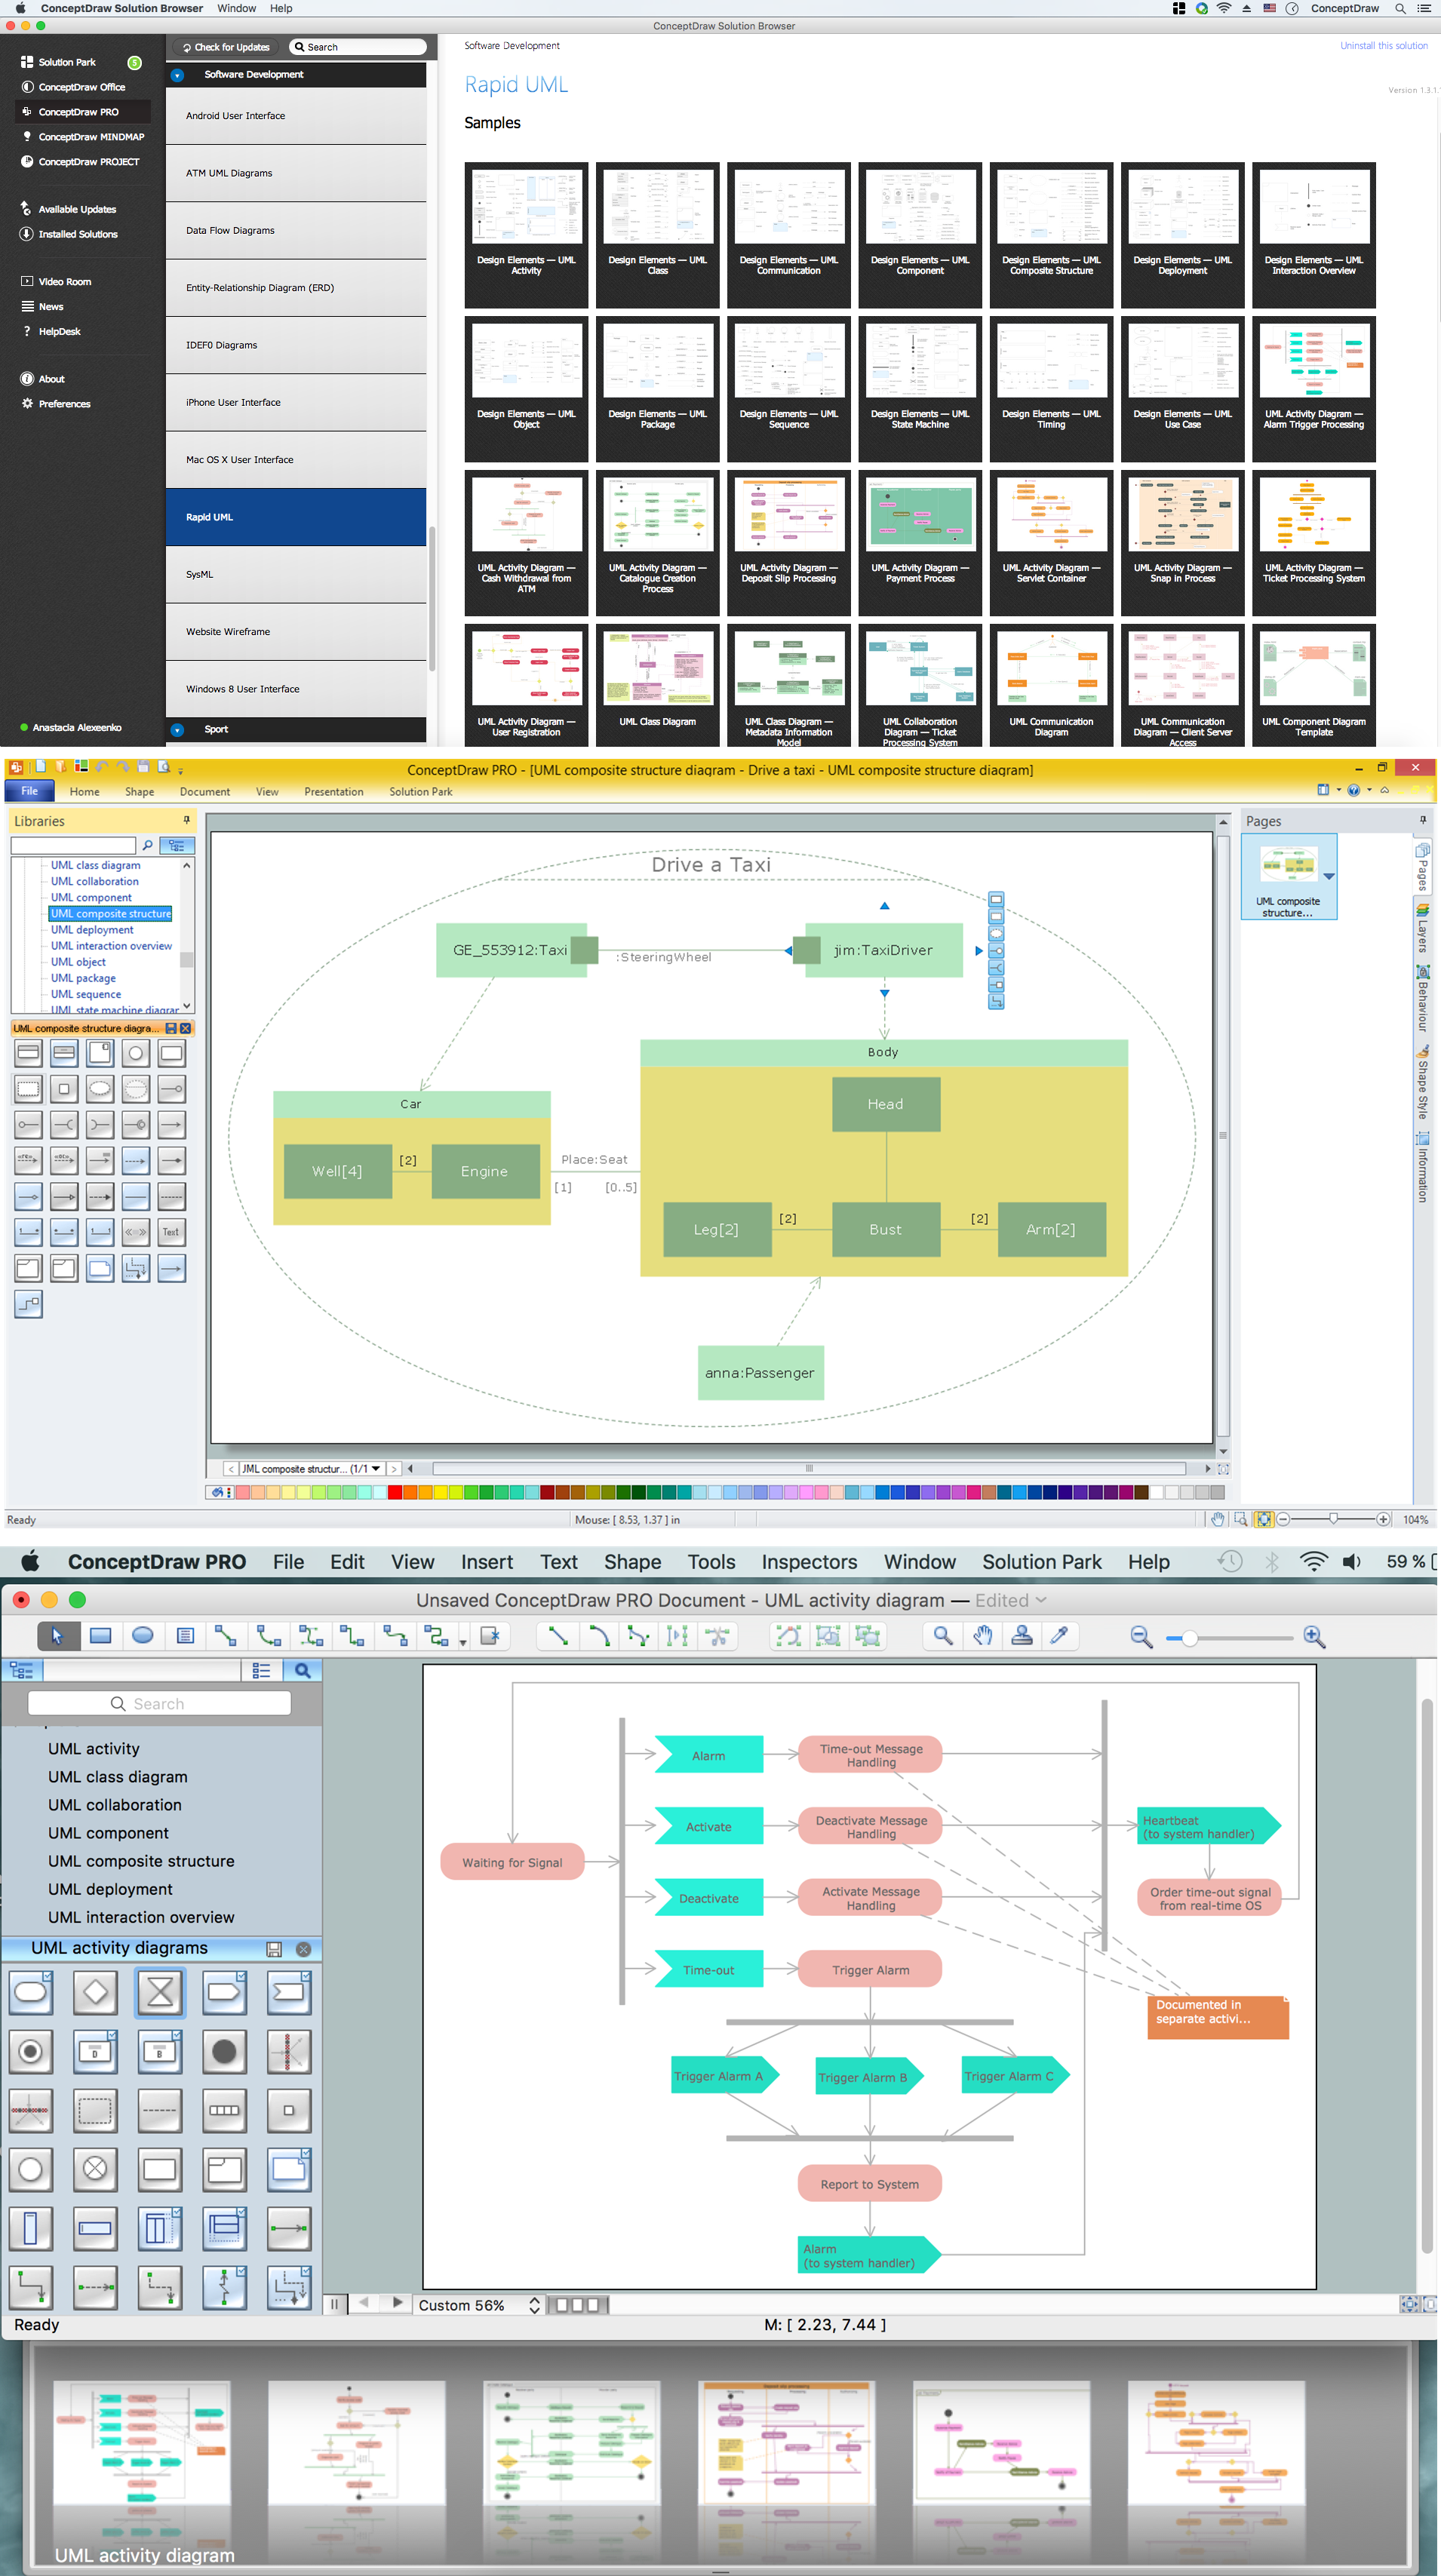
Picture: How to create your UML Diagram
Related Solution:
A software tool that saves your time on making decisions now has the ability to make decisions with remote team via Skype.
Picture: Decision Making Software For Small Business
Related Solution:
Database model is a graphic representation need at the beginning of project development. You won't have any problems with drawing ER diagrams on a Mac anymore with ConceptDraw DIAGRAM application. Special libraries that contain all the symbols of both Chen's and Crow’s foot notation allow you to start database modeling within a few minutes.
Creating entity-relationship diagrams on Mac is fun and effortless when you use a software designed for professional ERD drawing tailored to specific characteristics of Apple OS X. ConceptDraw DIAGRAM is a business diagramming software for those using OS X.
The Entity-Relationship Diagrams solution for ConceptDraw has 2 libraries containing about 50 vector icons, depicting ERD symbols of the most popular Chen's and Crow’s Foot Notations. The other valuable component of the solution is a collection of ERDs samples and templates that can be opened on Macs and PCs.
Picture: Drawing ER diagrams on a Mac
Related Solution:
The United Kingdom of Great Britain and Northern Ireland, commonly known as the United Kingdom (UK), is a sovereign state in Europe which consists of four countries: England, Scotland, Wales, and Northern Ireland. UK is surrounded by the waters of Atlantic ocean, the North Sea, the English Channel, and the Irish Sea and includes large number of big and small islands.
ConceptDraw DIAGRAM diagramming and vector drawing software offers the unique Map of UK Solution from the Maps Area of ConceptDraw Solution Park that is indispensable for easy drawing professional looking map of UK, UK counties map, UK map with cities, map of Scotland, map of England, map of Wales, Northern Ireland map.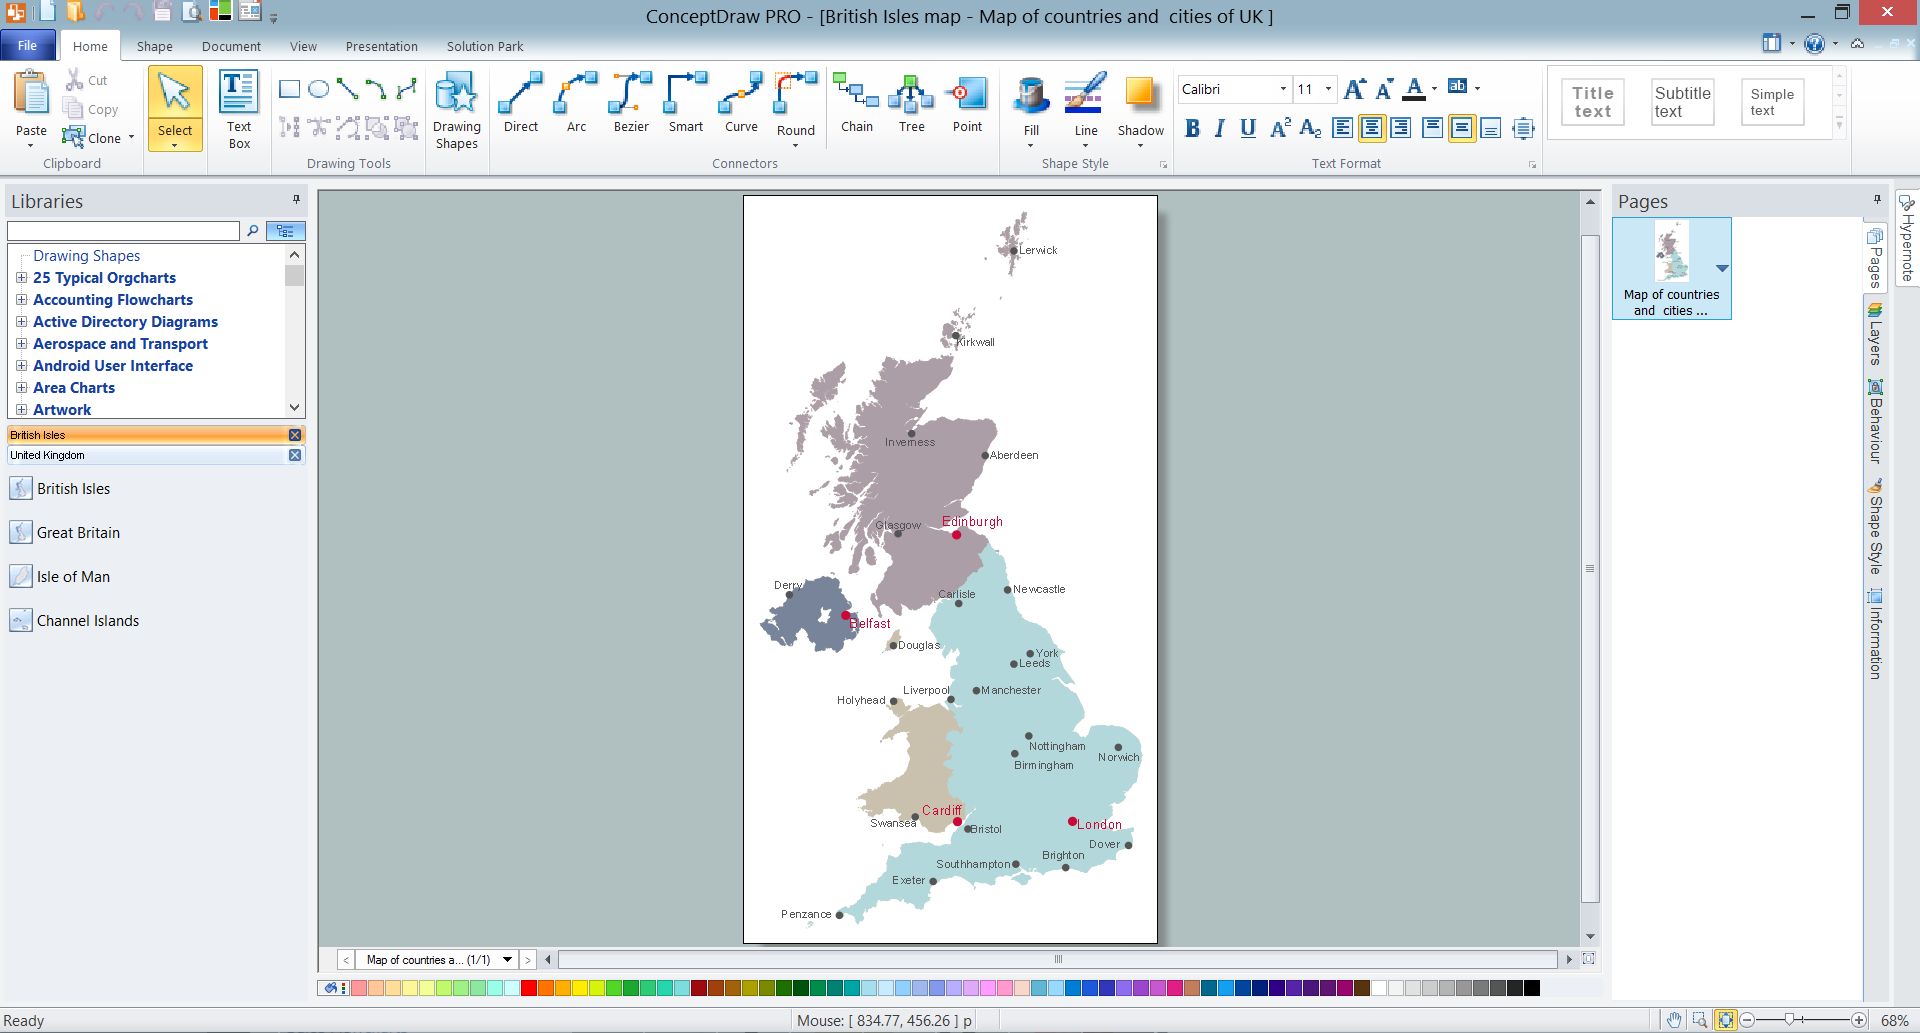
Picture: UK Map
Related Solution:
ConceptDraw DIAGRAM diagramming and vector drawing application is a powerful IDEF0 software thanks to the IDEF0 Diagrams solution from the Software Development area of ConceptDraw Solution Park.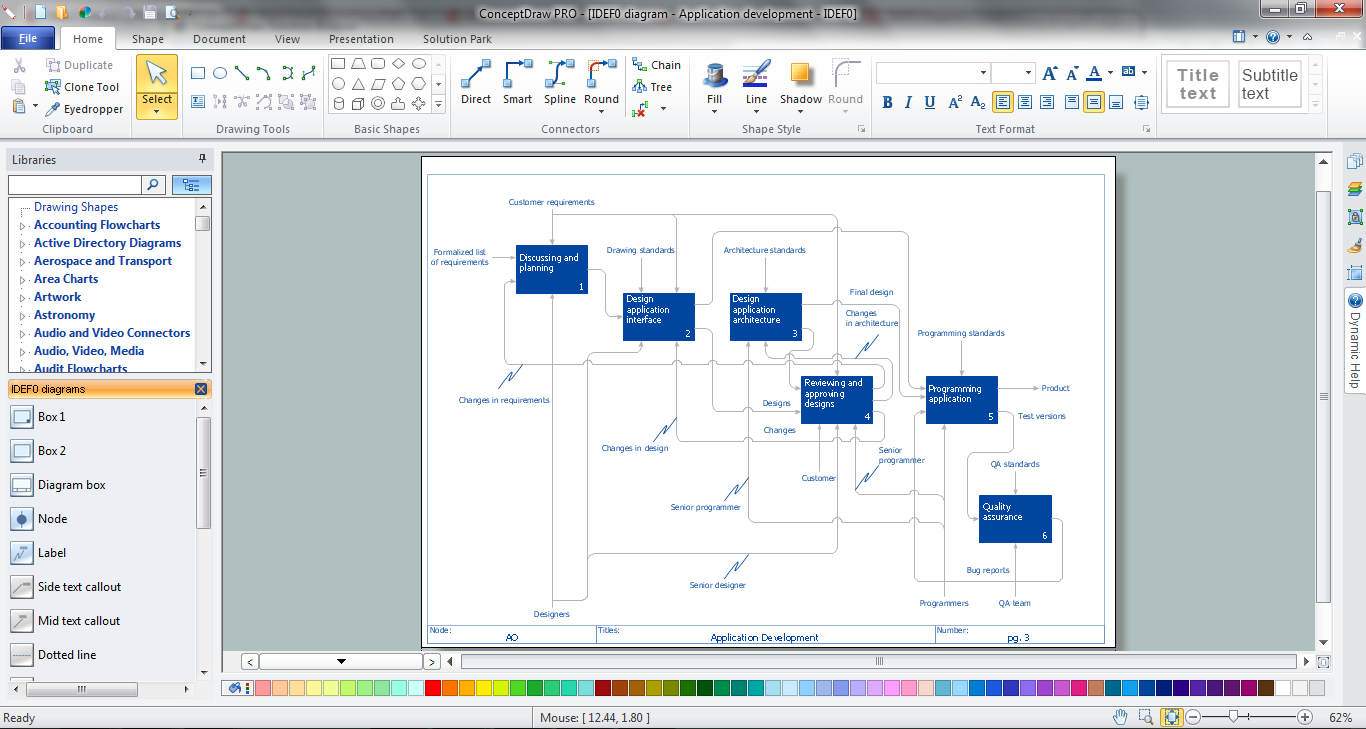
Picture: IDEF0 Software
Related Solution: