Made with
ConceptDraw
DIAGRAM 18

Process Flow Chart Examples

Process Flow Chart is a visual illustration of overall flow of activities in producing a product or service. How do you make a Process Flow Chart usually? Drawing process flow charts, diagrams and maps is quite complex and lengthy process, especially if you draw free-hand. But now thanks to the ConceptDraw DIAGRAM diagramming and vector drawing software extended with Flowcharts solution from the "Diagrams" area of ConceptDraw Solution Park this process became simple and fast. A confirmation of this can serve many Process Flow Chart examples included in Flowcharts solution.

Process Flow Chart Examples *

Example 1. Process Flow Chart Examples - Approval Process

Variety of Process Flow Chart examples was developed specially for Flowcharts Solution and is available for ConceptDraw DIAGRAM users from ConceptDraw STORE. Here are represented both simple and complex Process Flow Chart examples. Each of them can be opened in ConceptDraw DIAGRAM by simple clicking on its preview in ConceptDraw STORE and then edited according to your needs.

Process Flow Chart Example

Example 2. Process Flow Chart Example

Even looking at these several examples presented on this page, you can already see what they are all bright, professional looking and attractive. So they can be bravely used on various conferences, in discussions and will have great success. These diagrams use commonly used symbols, hence they will be easily understood and accepted by your interlocutors. All used objects are available in Flowchart and Flowcharts Rapid Draw libraries also included in Flowcharts solution.

Process Flow Chart Examples - Planning Process

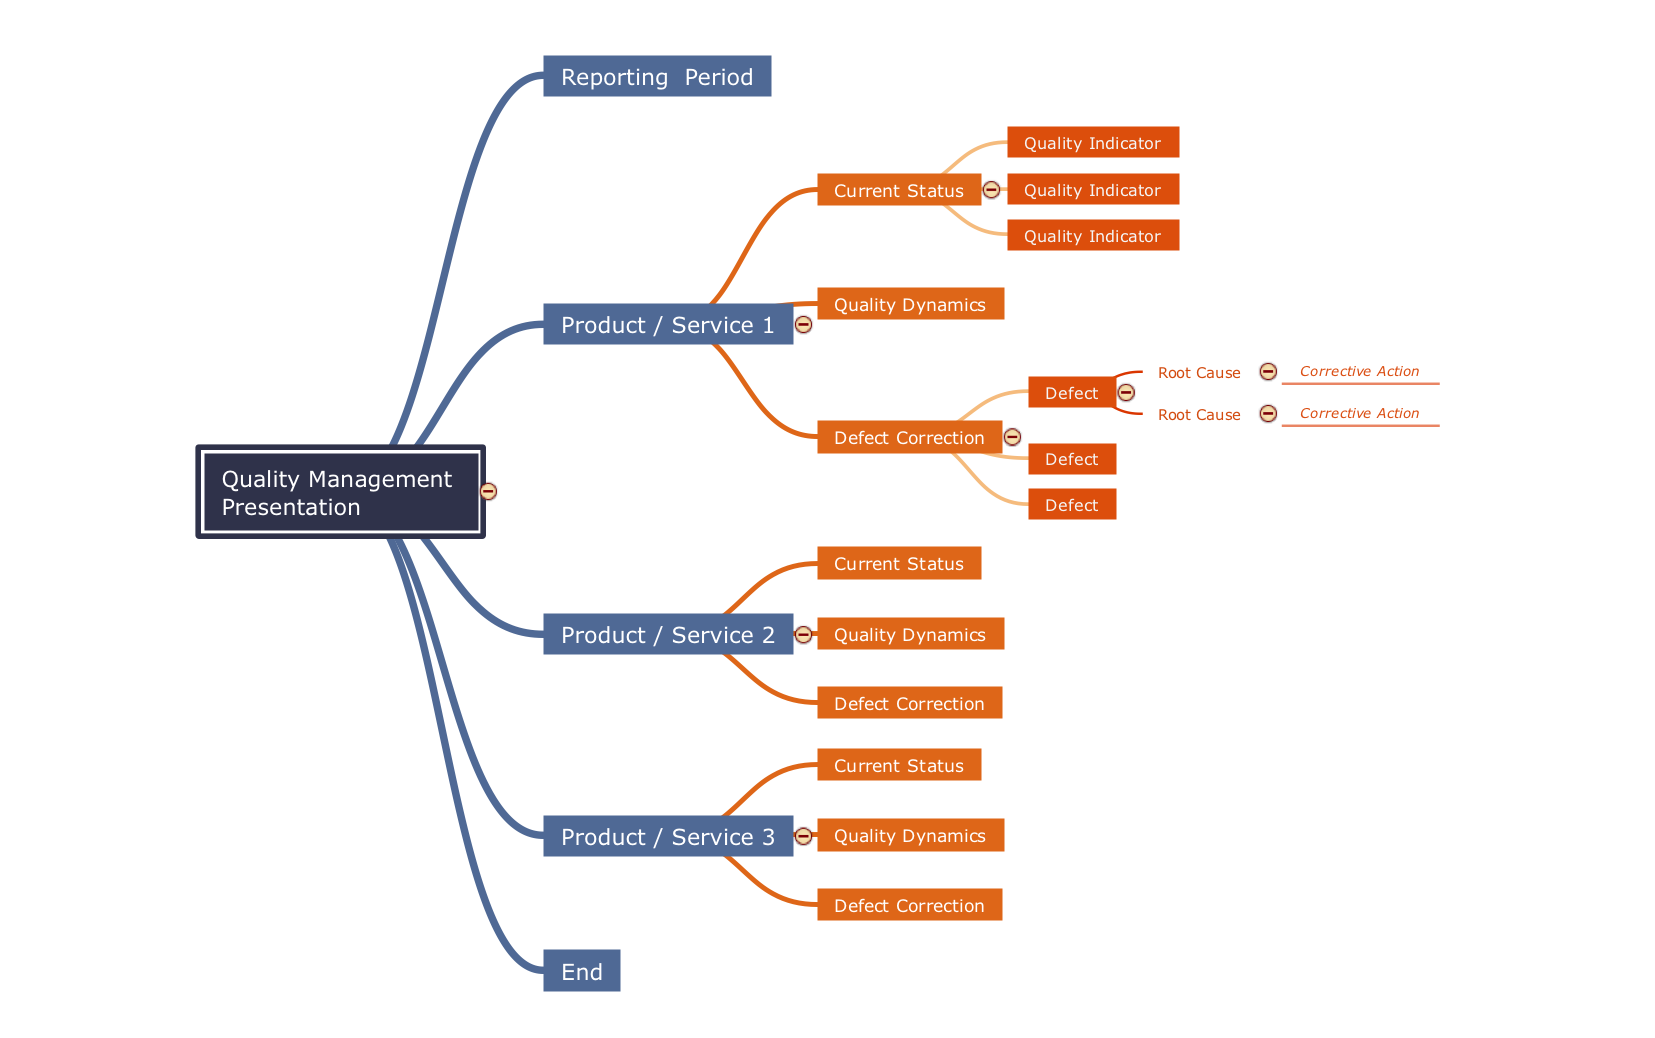
Example 3. Process Flow Chart Examples - Planning Process

The Process Flow Chart examples you see on this page were created in ConceptDraw DIAGRAM software using the Flowcharts Solution for ConceptDraw DIAGRAM Solution Park. Each example Process Flow Chart successfully demonstrate solution's capabilities and professional results you can achieve. An experienced user spent 10-15 minutes creating every of these samples.

Use the Flowcharts Solution for ConceptDraw DIAGRAM software to design your own professional looking process flow chart examples, data flow chart examples of any complexity quick, easy and effective, and then successfully use them in your work activity.

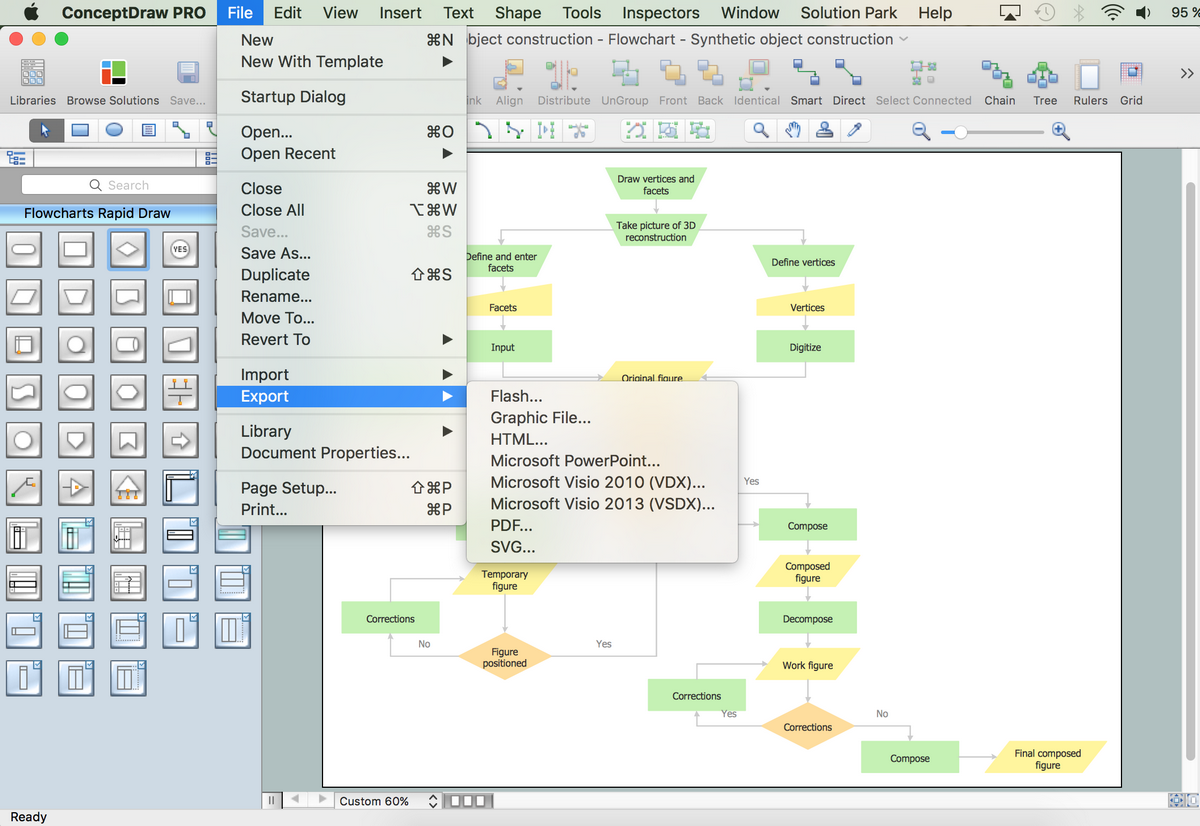
All source documents are vector graphic documents. They are available for reviewing, modifying, or converting to a variety of formats (PDF file, MS PowerPoint, MS Visio, and many other graphic formats) from the ConceptDraw STORE. The Flowcharts Solution is available for all ConceptDraw DIAGRAM or later users.


TEN RELATED HOW TO's:
Use ConceptDraw DIAGRAM software with Flowcharts Solution to create Process Flow Charts, Flow Chart Process Maps, and High-Level Process Flow Charts to illustrate ✔️ high-level processes in industrial, chemical, and process engineering, ✔️ major plant processes, ✔️ minor detailsProcess Flow Chart
Picture: Process Flow Chart
Related Solution:
Start design your own flowchart with ConceptDraw DIAGRAM and accomplish great results at the moment.Draw Flowcharts with ConceptDraw *
Picture: Draw Flowcharts with ConceptDraw
Related Solution:
Problems are obstacles and challenges that one should overcome to reach the goal. They are an inseparable part of any business, and the success of an enterprise often depends on ability to solve all problems effectively. The process of problem solving often uses rational approach, helping to find a suitable solution. Using Fishbone Diagrams for Problem Solving is a productive and illustrative tool to identify the most important factors causing the trouble. ConceptDraw DIAGRAM extended with Fishbone Diagrams solution from the Management area of ConceptDraw Solution Park is a powerful tool for problem solving with Fishbone Ishikawa diagram graphic method.Using Fishbone Diagrams for Problem Solving *
Picture: Using Fishbone Diagrams for Problem Solving
Related Solution:
Fishbone diagram is a powerful tool used for solving business problems and obstacles. ConceptDraw DIAGRAM software extended with Fishbone Diagrams solution from the Management area of ConceptDraw Solution Park is a helpful tool for cause and effect analysis. It gives the ability to easy identify many possible causes and factors which cause the effects and to draw Fishbone Diagrams for problem solving.Cause and Effect Analysis - Fishbone Diagrams for Problem Solving *
Picture: Cause and Effect Analysis - Fishbone Diagrams for Problem Solving
Related Solution:
Having the already previously created samples of the Venn diagrams can help any ConceptDraw DIAGRAM user make it possible to make the needed drawing within only a few minutes by editing the existing ones.Venn Diagram Examples for Problem Solving — BQP Complexity
Picture: Venn Diagram Examples for Problem Solving
Related Solution:
A flowchart is a powerful tool for examining processes. It helps improving processes a lot, as it becomes much easier to communicate between involved people, to identify potential problems and to optimize workflow. There are flowcharts of different shapes, sizes and types of flowchart vary from quite basic process flowcharts to complex program flowcharts. Nevertheless, all these diagrams use the same set of special symbols like arrows to connect blocks, parallelogram to show data receiving or rectangles for showing process steps. Basic flowcharts are used to represent a simple process algorithm. A basic flowchart notation consists of rectangles (business processes), arrows (the flow of information, documents, etc.). The same notation is used in items such as the "decision", which allow you to do the branching. To indicate the start of the entire business process and its termination can be used the "Terminator" element. The advantages of Basic Flowchart are simplicity and clarity. With it you can quickly describe the business process steps. Creating of Basic Flowchart does not require any special knowledge, as easily understand by employees with different levels of education and IQ.Types of Flowchart — Overview
Picture: Types of Flowchart: Comprehensive Overview
Related Solution:
Workflow Diagram - workflow process diagram is a visual representation of a organizational process flow. Often it used as the same visual notation as process flow diagram. Visualising business processes using workflow diagram (workflow process diagram) allows estimate business process efficiency, analyse and optimize the process itself. Workflow diagram helps get focusing on each step and relations between workflow steps. ConceptDraw DIAGRAM is software for making workflow diagram. It contains specific designed graphics to draw workflow diagrams effectively. This is workflow diagram maker which do your work process effective.Work Flow Process Chart *
Picture: Work Flow Process Chart
Related Solution:
A pie chart or a circle graph is a circular chart divided into sectors, illustrating numerical proportion. In a pie chart, the arc length of each sector and consequently its central angle and area, is proportional to the quantity it represents. Pie chart examples and templates created using ConceptDraw DIAGRAM software helps you get closer with pie charts and find pie chart examples suite your needs.Pie Chart Examples and Templates *
Picture: Pie Chart Examples and Templates
Related Solution:
Flow chart is a diagrammatic representation of an algorithm and essential part of planning the system. Flow charts are widely used in technical analysis and programming for easy writing programs and explaining them to others. So, one of the most popular type of flow charts is Technical Flow Chart. Technical Flow Chart can be drawn by pencil on the paper, but it will be easier to use for designing a special software. ConceptDraw DIAGRAM diagramming and vector drawing software extended with Flowcharts Solution from the Diagrams Area of ConceptDraw Solution Park will be useful for this goal.Technical Flow Chart *
Picture: Technical Flow Chart
Related Solution:
Create bar charts for visualizing problem solving in manufacturing and economics using the ConceptDraw DIAGRAM diagramming and vector drawing software extended with the Bar Graphs Solution from the Graphs and Charts area of ConceptDraw Solition Park.Bar Diagrams for Problem Solving. <br>Create manufacturing and economics bar charts with Bar Graphs Solution *
Picture: Bar Diagrams for Problem Solving. Create manufacturing and economics bar charts with Bar Graphs Solution
Related Solution:
ConceptDraw
DIAGRAM 18