
Example 1. Examples Flowchart - Basic Flowchart
The examples flowchart developed and included in Flowcharts Solution are available for viewing and editing from ConceptDraw STORE which is incredibly convenient for navigation through ConceptDraw Solution Park, all solutions libraries, templates and samples.
Depending on the aims and needs are used the flowcharts of various types. Some special types of flowcharts are represented here, you can click to enlarge images:
Look at these examples flowchart and more other represented in ConceptDraw STORE, they are professional looking, bright, beautiful and attractive. They are also understandable for all thanks to the use of commonly used flowchart objects which are predesigned and available from Flowchart and Flowcharts Rapid Draw libraries of Flowcharts solution.

Example 2. Flowcharts Solution in ConceptDraw STORE
The samples you see on this page were created in ConceptDraw DIAGRAM software using the objects from the libraries of Flowcharts Solution. These examples flowchart successfully demonstrate solution's capabilities and professional results you can achieve. An experienced user spent 10 minutes creating each of these samples.
Use the tools of Flowcharts Solution for ConceptDraw DIAGRAM software to draw Flow Charts and Process Flow Charts of any complexity quick, easy and effective.
All source documents are vector graphic documents. They are available for reviewing, modifying, or converting to a variety of formats (PDF file, MS PowerPoint, MS Visio, and many other graphic formats) from the ConceptDraw STORE. The Flowcharts Solution is available for all ConceptDraw DIAGRAM or later users.
TEN RELATED HOW TO's:
This sample was created in ConceptDraw DIAGRAM diagramming and vector drawing software using the UML Deployment Diagram library of the Rapid UML Solution from the Software Development area of ConceptDraw Solution Park.
This sample shows the work of the ATM (Automated Teller Machine) banking system that is used for service and performing of the banking transactions using ATMs. System engineers can use comprehensive UML diagrams solution.
Picture: UML Deployment Diagram Example - ATM SystemUML diagrams
Related Solution:
When you need to draw a professional management drawing, these management design elements, samples, templates and libraries with vector clip art for drawing the Marketing Illustrations. Conceptdraw symbols and signs you can use in your design for Strategic Management, Graphic Design, Planning implementation and more.
You can create and view impact analysis drawings from specific design elements to examine the tasks.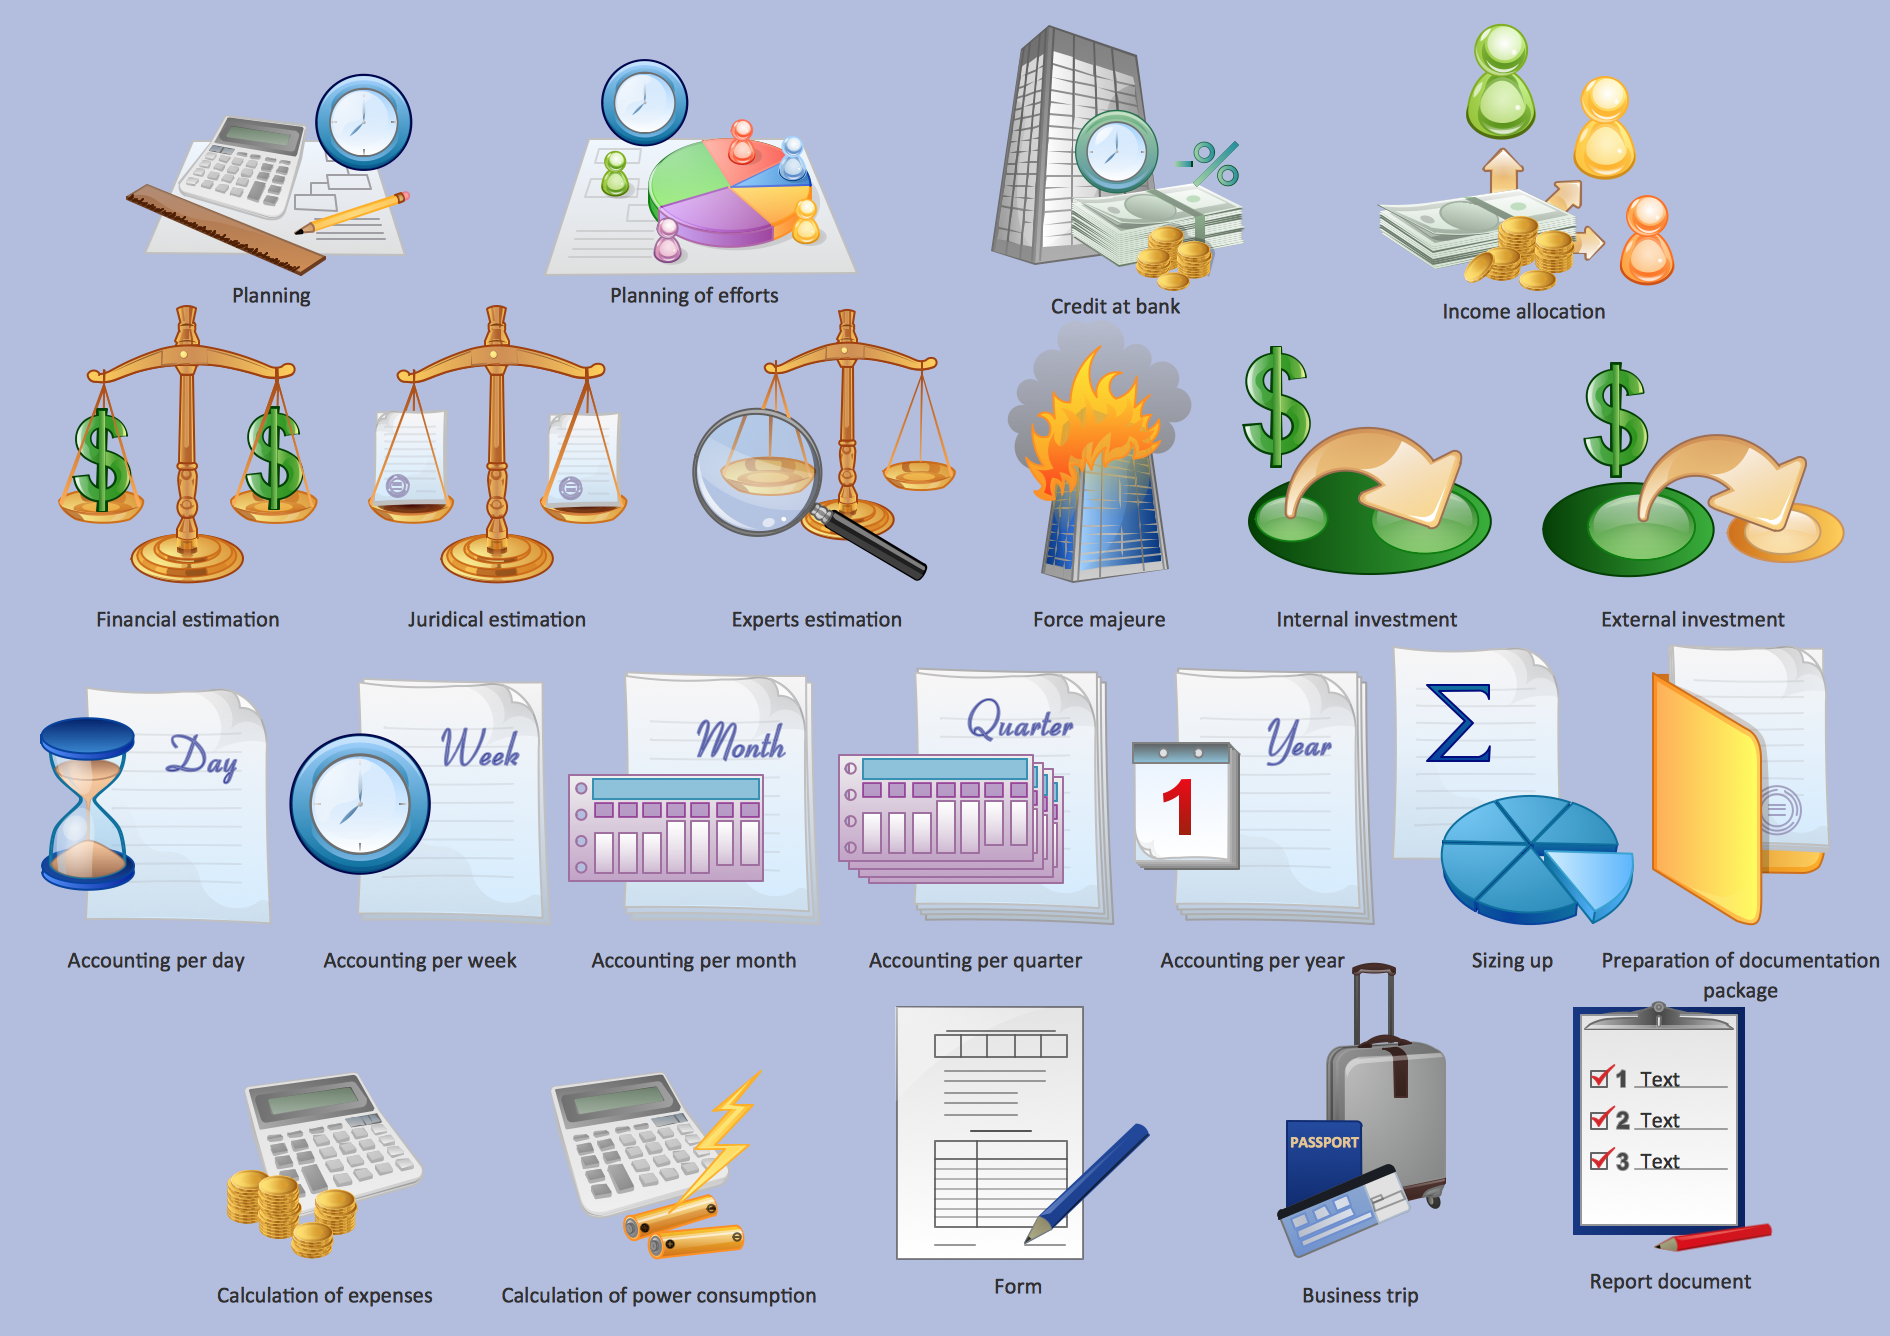
Picture: Management - Design Elements
Related Solution:
ConceptDraw DIAGRAM is a powerful tool that helps you create professional looking cross-functional flowcharts with the well-designed objects. ConceptDraw DIAGRAM - Drawing Software for Vertical Cross Functional Flowchart. ConceptDraw allows you to focus on work, not the drawing process. ConceptDraw Arrows10 Technology allows to draw connectors with smart behavior that gives flexibility to you during work process.
Picture: Vertical Cross Functional Flowchart
What is organizational charts and why your business need them? How to use business process diagram software? Explore how advanced organization chart software transforms the way companies ✔️ visualize, ✔️ communicate, and ✔️ streamline their organizational hierarchies
Picture:
What is an Organizational Chart and how it works?
Organization Chart Software
Related Solution:
This sample was created in ConceptDraw DIAGRAM diagramming and vector drawing software using the Organizational Charts Solution from the Software Development area of ConceptDraw Solution Park.
This sample shows the organizational chart in the field of Architect Engineering. Create your own orgchart professional drawings using ConceptDraw.
Picture: Business Board Org Chart
Related Solution:
ConceptDraw DIAGRAM is a powerful chemistry drawing software that provides the useful tools to help you design all kinds of chemistry drawings and illustrations, chemical schemes and diagrams of formulas, reaction schemes and lab set-ups of any complexity.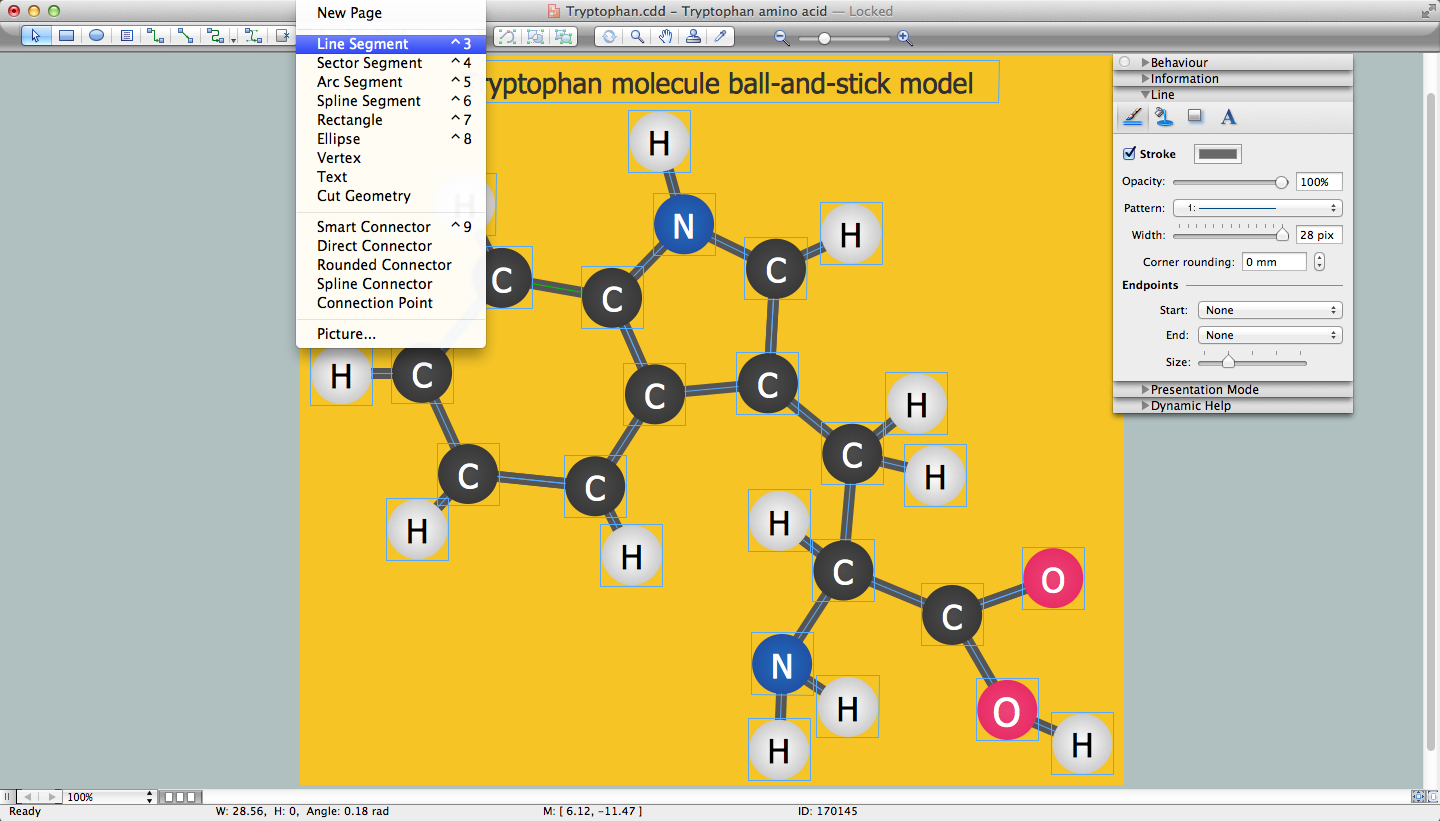
Picture: Chemistry Drawing Software
Related Solution:
Do you like the professional schemes that you can find on the Internet? Take into account that the most part of them is made using the Best Flowchart Software and Flowchart Symbols. Try you own powers in creating such diagrams!
Flowcharts are the most business diagramming tool. If you are a business manager, you can use flow chart to depict work flow in your organization, develop the effective organizational structure and present the information to investors or other stakeholders. Combining the smart management solutions with ConceptDraw DIAGRAM diagramming engine delivers the set of comprehensive flowchart tools necessary to support professionals in their creativeness and business activity.
Picture: Best Flowchart Software and Flowchart Symbols
Related Solution:
ConceptDraw DIAGRAM is a flowchart design software. There are large collections of professional flowchart symbols for process flow diagrams, standard flowchart symbols and colored basic flowchart symbols. Built-in examples and video lessons allow users to get started immediately and do drawing of virtually any type of flowchart or process flow diagrams
Picture: Flow Chart Creator
Related Solution:
UML Use Case Diagram Taxi Service - This sample was created in ConceptDraw DIAGRAM diagramming and vector drawing software using the UML Use Case Diagram library of the Rapid UML Solution from the Software Development area of ConceptDraw Solution Park.
This sample shows the work of the taxi service and is used by taxi stations, by airports, in the tourism field and delivery service.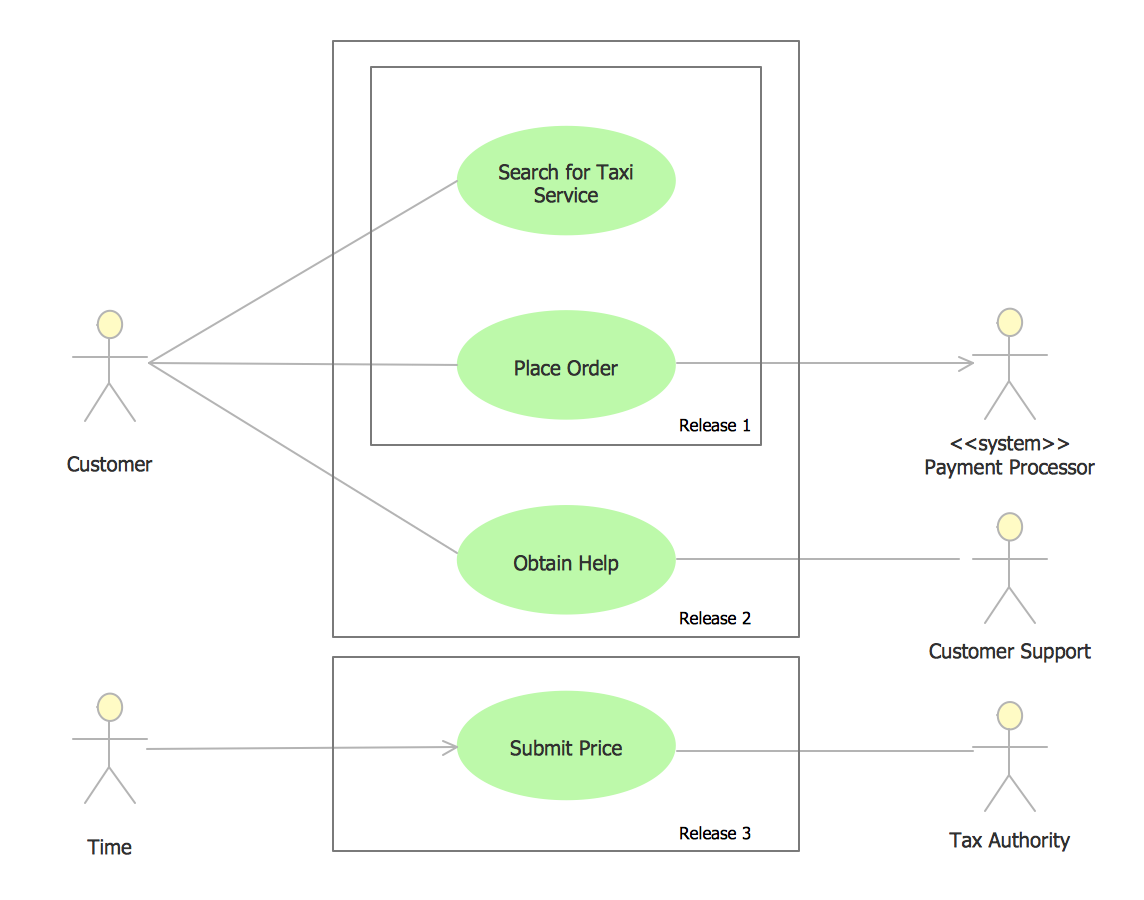
Picture: UML Use Case Diagram Example - Taxi Service
Related Solution:
State Diagram UML of Online Store. This sample was created in ConceptDraw DIAGRAM diagramming and vector drawing software using the UML Class Diagram library of the Rapid UML Solution from the Software Development area of ConceptDraw Solution Park.
This sample shows the work of the medical shop and is used at the creation of the medical shop or pharmacy project, for understanding the process of shopping in the medical shop, for keeping purchases, for medical supplies.
Picture: UML Class Diagram Example - Medical Shop
Related Solution:
")

")


