

Examples of UML Collaboration Diagram
This is an example of UML Collaboration Diagram for an Client server access process.

This UML collaboration diagram sample is created using ConceptDraw DIAGRAM diagramming and vector drawing software enhanced with Rapid UML solution from ConceptDraw Solution Park.

Rapid UML solution provides templates, examples and libraries of stencils for quick and easy drawing all the types of system and software engineering diagrams according to UML 2.4 and 1.2 notations.
Use ConceptDraw DIAGRAM with UML communication and collaboration diagrams templates, samples and stencil libraries from Rapid UML solution to show the interactions between objects or parts of your system in terms of sequenced messages.
TEN RELATED HOW TO's:
Structured-systems analysis and design method uses data flow diagrams to represent the process of data flowing through a system. Talking about this might be useless without a proper example of DFD for online store (Data Flow Diagram). This DFD example shows all the distinctness that a diagram can bring into a scattered data structure.
Data flow diagrams are used to show how data is processed within some business processes. Making DFD is a common practice for business process modeling and analysis. This diagram represents the online store business flow. It describes inputs and outputs within online selling process and depicts the interactions between its participants. This DF diagram can be used by system analysts to create an overview of a business, to study and discover its inherent strengths and weak points.
Picture: Example of DFD for Online Store (Data Flow Diagram)
Related Solution:
UML Diagrams Social Networking Sites Project. This sample was created in ConceptDraw DIAGRAM diagramming and vector drawing software using the UML Use Case Diagram library of the Rapid UML Solution from the Software Development area of ConceptDraw Solution Park.
This sample shows the Facebook Socio-health system and is used at the projection and creating of the social networking sites.
Picture: UML Use Case Diagram Example. Social Networking Sites Project
Related Solution:
The following examples cctv network were created in ConceptDraw DIAGRAM diagramming and vector drawing software using the Audio, Video, Media Solution. Using this easily customizable cctv network template you can represent any existing cctv network.
Picture: CCTV Network Example
Related Solutions:
ConceptDraw DIAGRAM extended with ATM UML Diagrams Solution from the Software Development Area of ConceptDraw Solution Park is a powerful software for representing the ATM processes, for designing and building banking system and ATMs.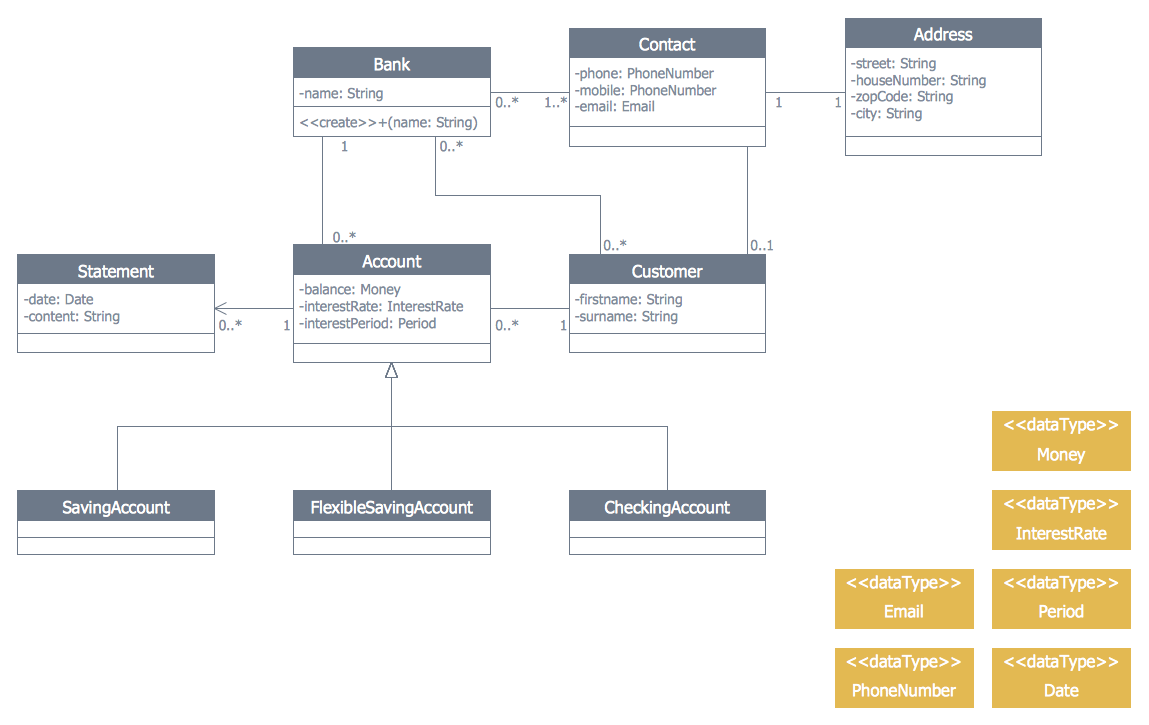
Picture: Banking System
Related Solution:
Samples, templates and libraries contain vector clip art for drawing the Road Transport Illustrations.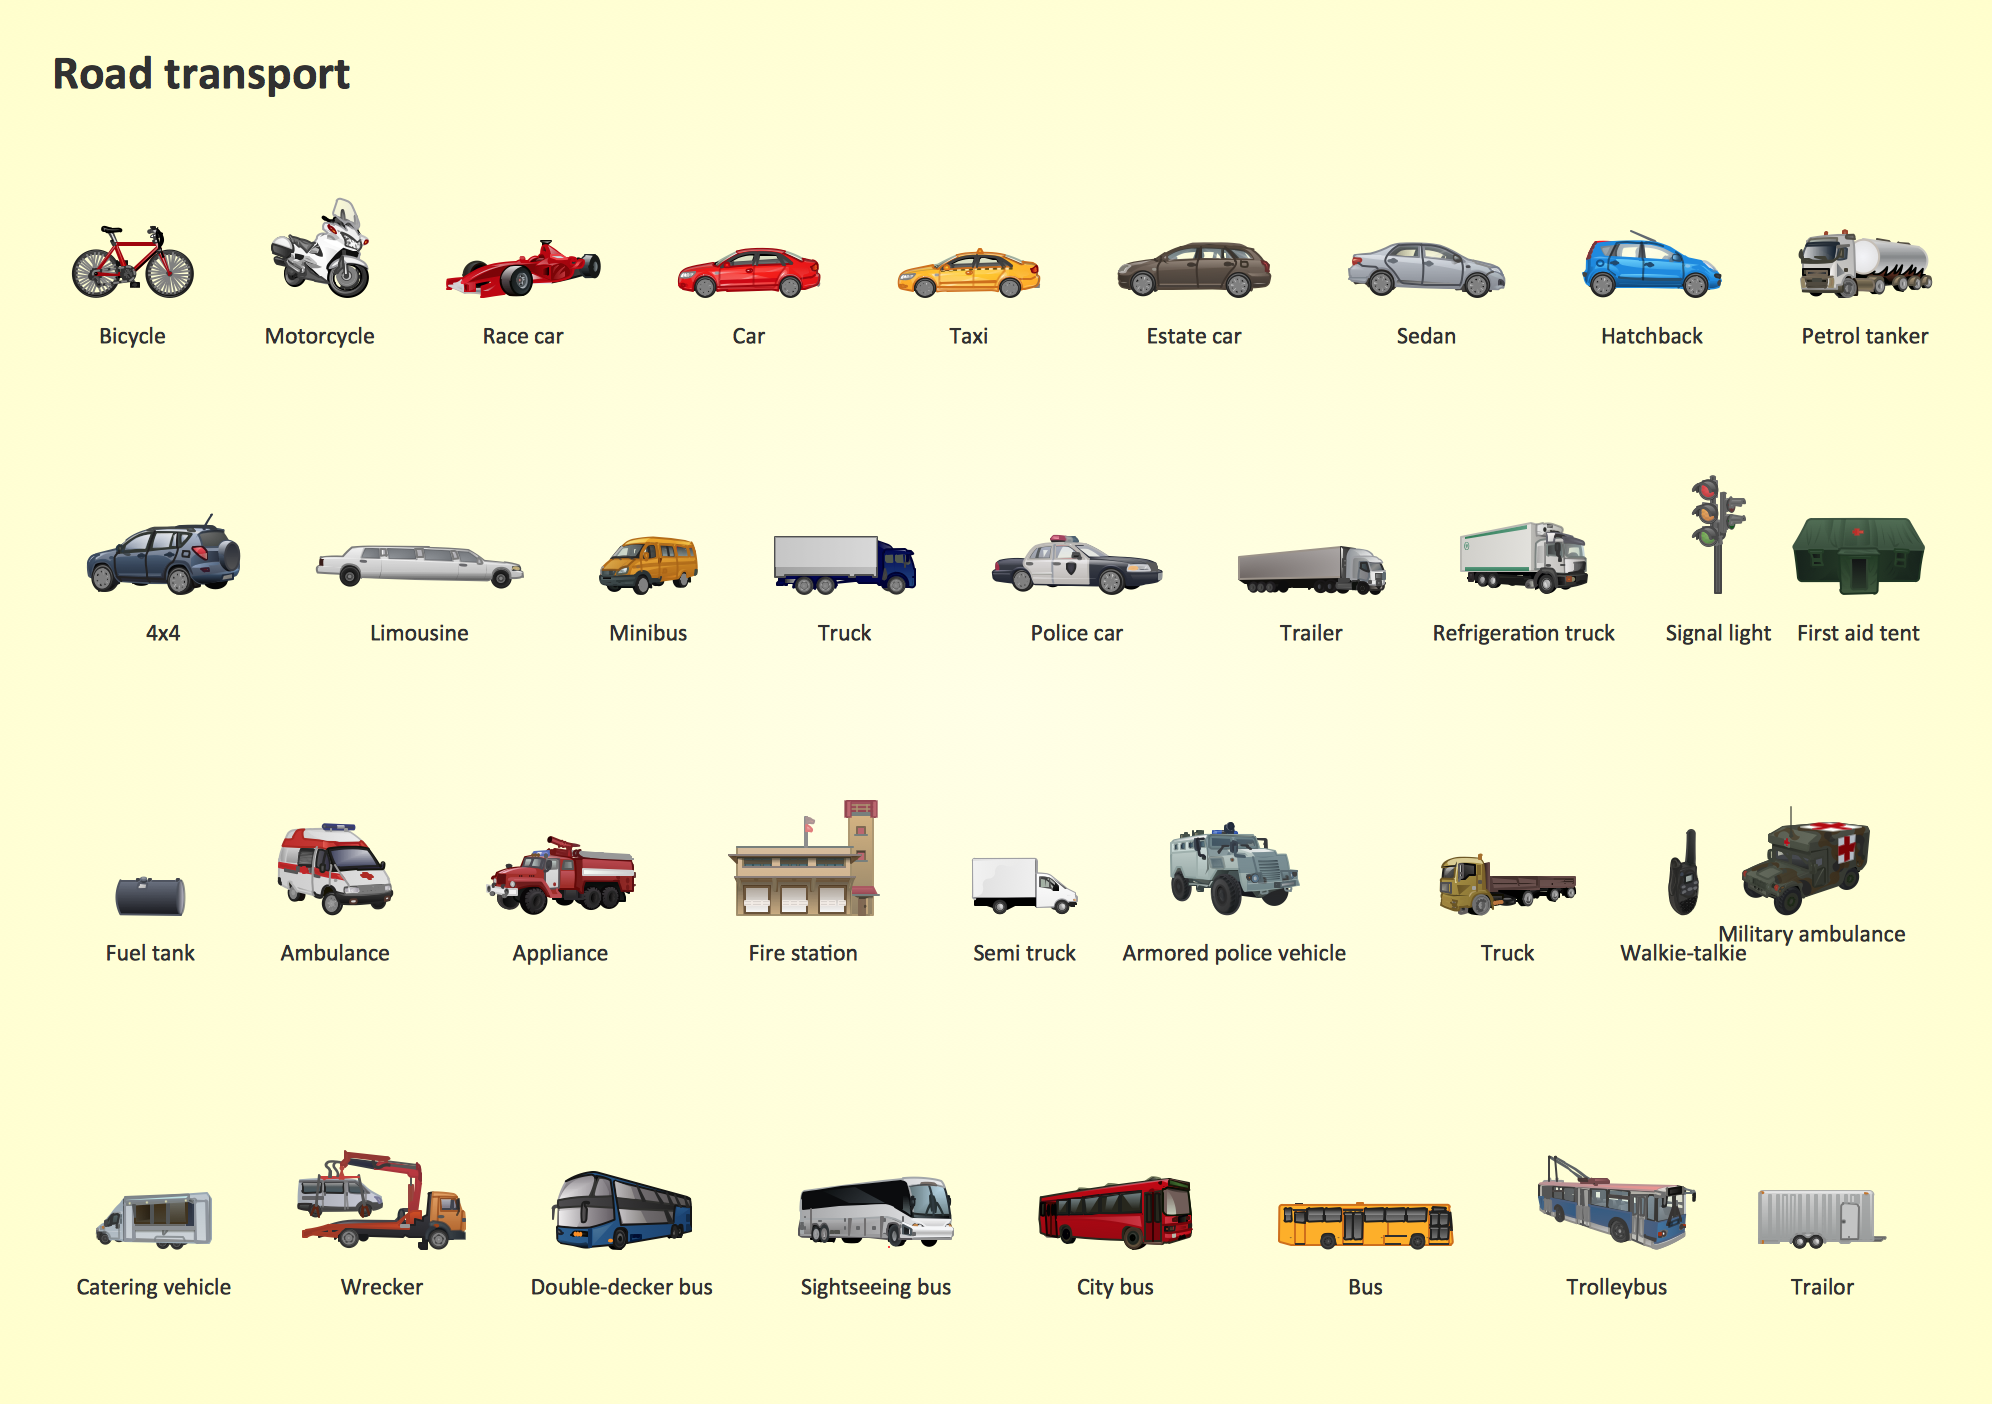
Picture: Road Transport - Design Elements
Related Solution:
A database is a data collection, structured into some conceptual model. Two most common approaches of developing data models are UML diagrams and ER-model diagrams. There are several notations of entity-relationship diagram symbols and their meaning is slightly different. Crow’s Foot notation is quite descriptive and easy to understand, meanwhile, the Chen notation is great for conceptual modeling.
An entity relationship diagrams look very simple to a flowcharts. The main difference is the symbols provided by specific ERD notations. There are several models applied in entity-relationship diagrams: conceptual, logical and physical. Creating an entity relationship diagram requires using a specific notation. There are five main components of common ERD notations: Entities, Actions, Attributes, Cardinality and Connections. The two of notations most widely used for creating ERD are Chen notation and Crow foot notation. By the way, the Crow foot notation originates from the Chen notation - it is an adapted version of the Chen notation.
Picture: ERD Symbols and Meanings
Related Solution:
This sample was created in ConceptDraw DIAGRAM diagramming and vector drawing software using the Workflow Diagrams Solution from the Software Development area of ConceptDraw Solution Park.
This sample shows the Workflow Diagram that clearly illustrates stages a BPM consists of and relations between all parts of business. The Workflow Diagrams are used to represent the transferring of data during the work process, to study and analysis the working processes, and to optimize a workflow.

Picture: Software Work Flow Process in Project Management with Diagram
Related Solution:
Structure of a software product might get very complex and complicated, if software engineers did not pay much attention to the architecture of the product. It will take a few minutes to create UML diagrams with ConceptDraw DIAGRAM , because this software is just perfect for diagramming. You can alter ready-to-use templates, or make your own, whatever you need.
This illustration represent the example of UML diagram made by using ConceptDraw Rapid UML solution. This activity diagram displays the stages of the software development process similar to a flow chart. This diagram depicts the states of elements in the software system. It can be applied to represent software and coding logic. This UML diagram was drawn with the help of the ConceptDraw Rapid UML solution which supplies the kit of vector libraries, containing the symbols of the Unified Modeling Language notations.
Picture: UML Diagrams with ConceptDraw DIAGRAM
Related Solution:
Boost your brand awareness and recognition through graphic design.
ConceptDraw DIAGRAM business graphics software provides wide opportunities for creativity and helps generate amazing visuals.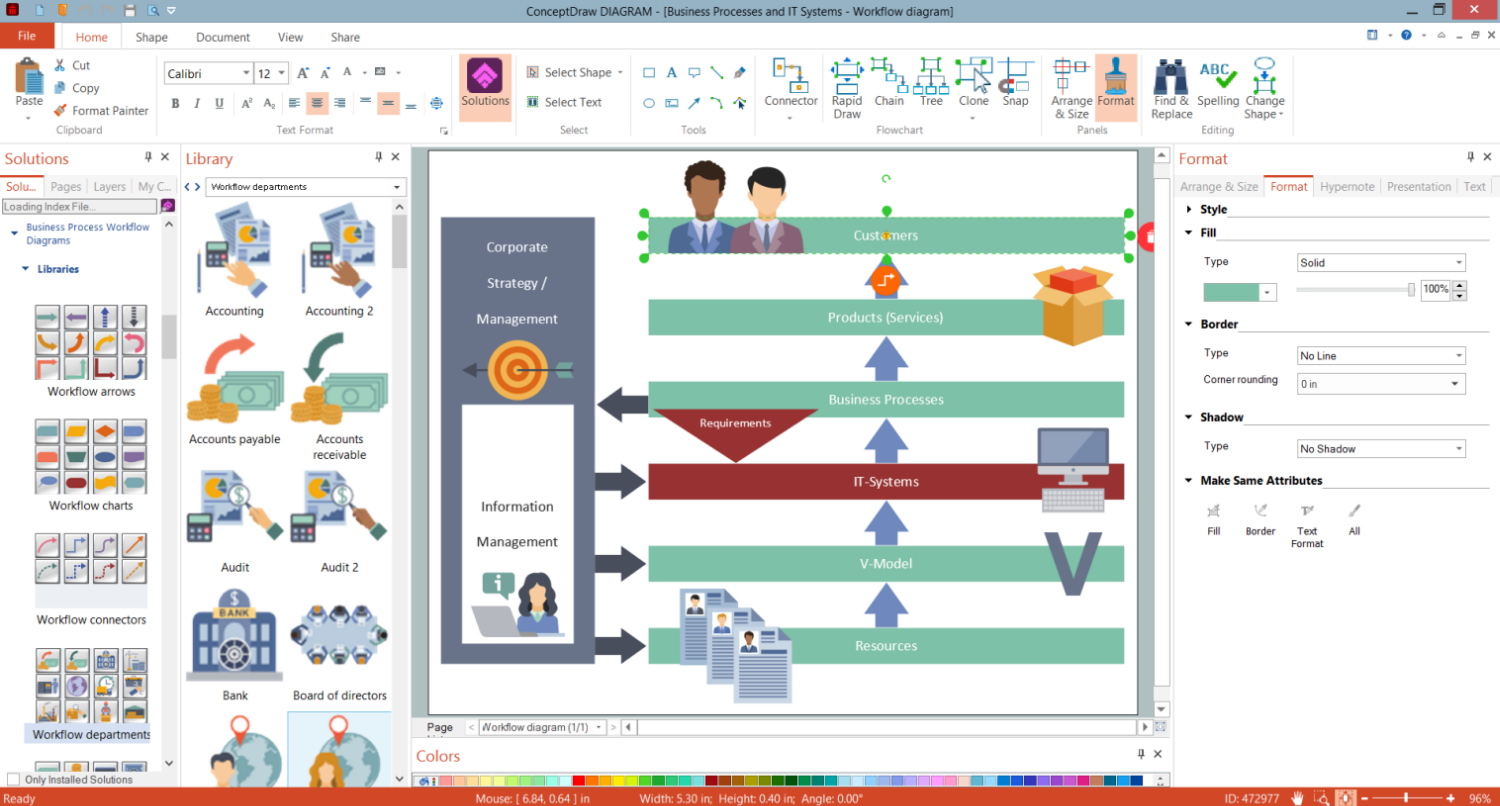
Picture: Business Graphics Software
The ability to develop UML diagrams as quickly as the ideas come. The solution uses ConceptDraw RapidDraw techniques. The result is a vector graphic document.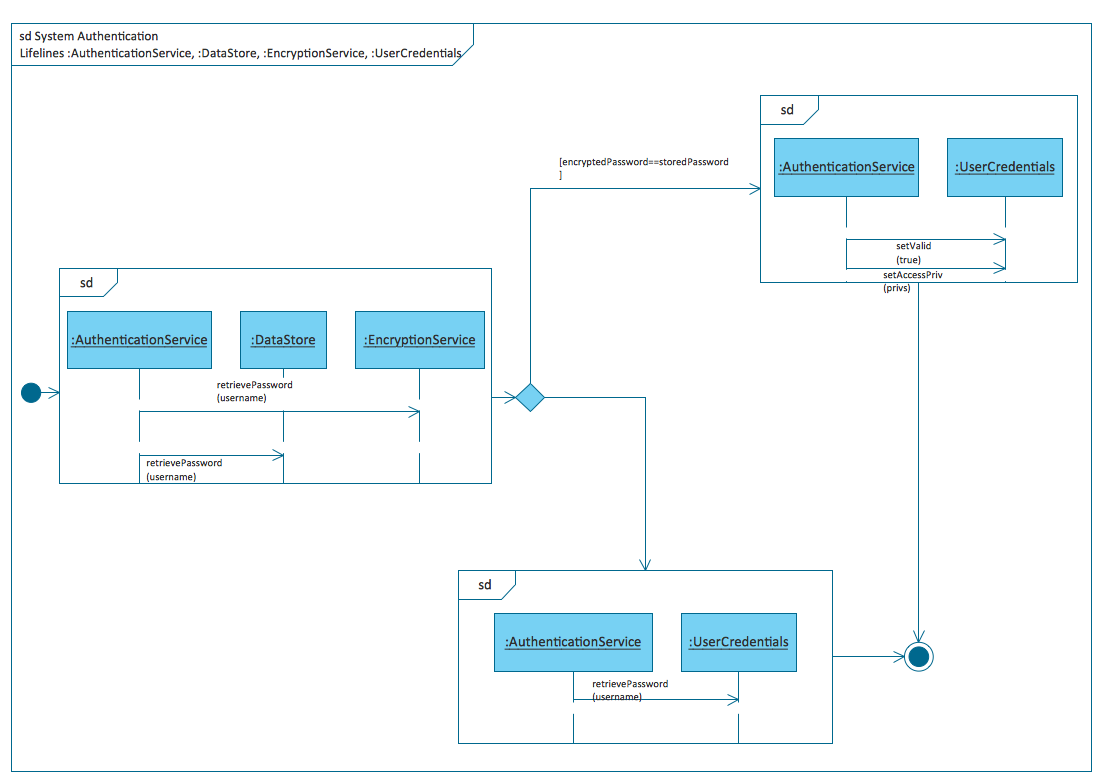
Picture: Introductory Guide to Rapid UML Solution
Related Solution:


