Data Flow Diagram Symbols. DFD Library
Data Flow DiagramData Flow Diagrams show information transfers and process steps of a system. The general concept is an approach of a depicting how occurs input in a system, further processes and what runs out. The aim of DFD is in accomplishing of understanding between developers and users. Data flow diagrams are maintained with other methods of structured systems analysis. A data flow diagram (DFD) illustrates how data is processed by a system in terms of inputs and outputs. As its name indicates its focus is on the flow of information, where data comes from, where it goes and how it gets stored.
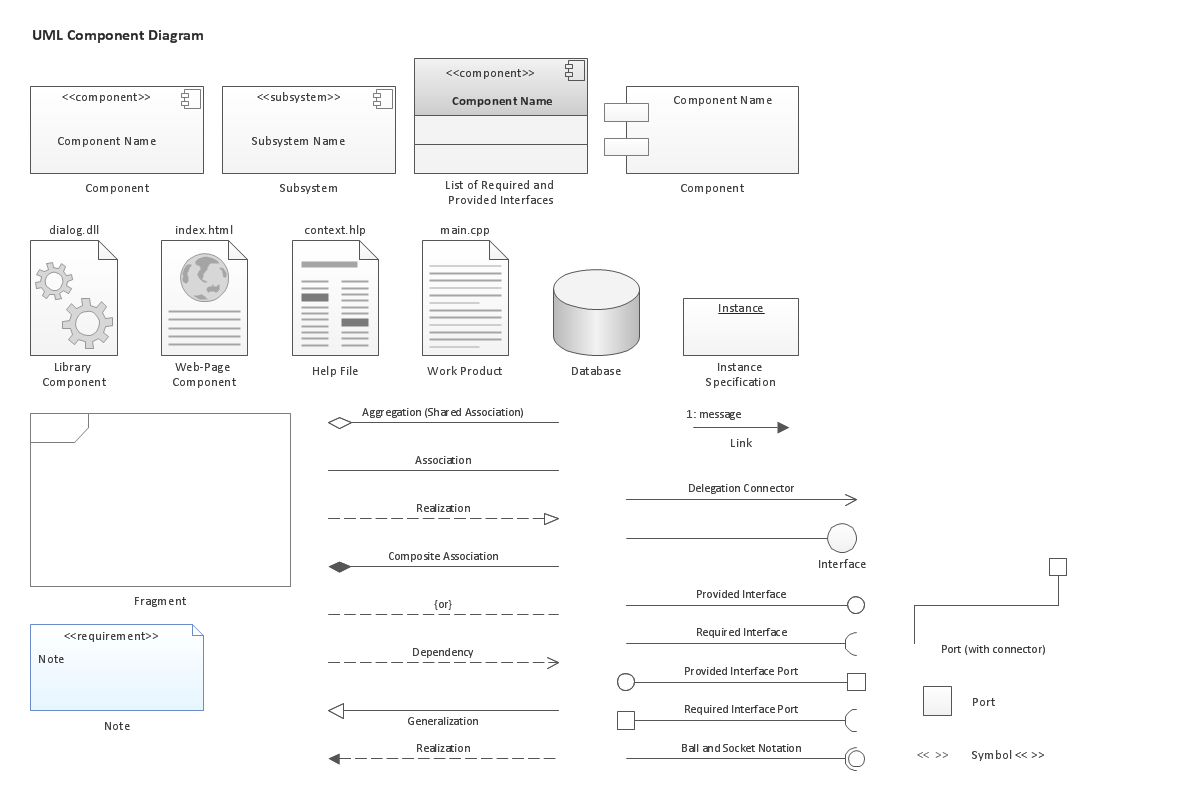
Data Flow Diagram (DFD) notationsThe Data Flow Diagrams solution from the Software Development area of ConceptDraw Solution Park provides three vector stencils libraries for drawing DFD using the ConceptDraw DIAGRAM diagramming and vector drawing software. The design elements library Data flow diagram (DFD) contains 15 data flow diagram symbols for drawing both context-level data flow diagram and Level 1 DFD. The design elements library DFD, Gane-Sarson notation contains 12 data flow diagram symbols of Gane-Sarson DFD notation. The design elements library DFD, Yourdon and Coad notation contains 22 data flow diagram symbols of Yourdon/DeMarco DFD notation. Use these DFD symbol libraries to design the process-oriented models, data-oriented models, data flowcharts, data process diagrams, structured analysis diagrams, and information flow diagrams.
Pic 1. Data Flow Diagram Symbols. DFD Library If you want to structure the huge amount of information, then you definitely need to put your data in order with help of a data flow diagram or “bubble chart” as it can also be called. Data flow diagram, or DFD, is a special tool which is widely used in systems designing activity. DFDs can be the context-level DFDs or Level 1 DFDs showing the details of the system, which is currently being modelled. The Level 1 data flow diagram shows in what way some system is divided into sub-systems, illustrating the processes which take place within this system. Each of these processes is connected with one data flow or mane different data flows. These data flows are represented in the connection with the external agent and they provide all of the system functionality, representing it as a whole. Such type of diagram identifies the internal data stores, which are meant to be presented in order for the system to function, and it shows the flow of data among the different parts of one system. Creating such data flow diagram, you have to take into consideration the SSADM design method and the structured-systems analysis. The investor, involved in a project, as well as the end users, will need to be consulted on every single stage of some particular system's evolution. Using a data flow diagram, means being able to visualize the way how some system can operate, what this system will accomplish and how it will be implemented. Such diagrams can be also used to provide the end user with a physical idea of where the data they input has an effect on the whole system and so to be able to report about it later. Creating a data flow diagram model means representing the way, in what some system can be developed and so it can be determined. While creating such data flow diagram, the analyst or the designer addresses the way some system may be decomposed into its components (sub-systems), and he identifies the data transaction in some data model. Data flow diagrams are very widely used in the Analysis phase and the Design phase in the SDLC. You can use different notations in order to draw data flow diagrams, such as Yourdon and Coad; and Gane and Sarson notations. You can define different visual representations for data flow, processes, data stores and external entities of a system while creating a data flow diagram. To be able to make one of the described above diagrams, you can also try to make it from a scratch, creating all of the constitutes yourself. But it can be a hard job and it can take lots of your time, especially if you do not really know how to make them. Having not as much experience in making the design elements which should be the constitutes of your data flow diagram and not knowing what to start with and which software to use to be able to make a great and professionally looking DFD is not a problem. As we can recommend you to use a truly unique and very convenient software, which is ConceptDraw DIAGRAM one, that can help you to make any diagram you want, including the data flow one, in only a couple of hours or even minutes. Sounds interesting? Yes, once you download ConceptDraw DIAGRAM and so the appropriate solutions which consists of the needed design symbols in the stencil libraries and so the examples of pre-made diagrams, you will be able to make your own DFD using the existing template during only a couple of hours. If you already have some experience of using ConceptDraw DIAGRAM software, then it can take you even less time as you must already know where to get the solutions from and how to use what they consist of. Illustrating the way how data is being processed within some system in terms of its inputs and outputs in a way of DFD is very convenient. You can always mention on the flow of information where this data comes from, where it goes to as well as the way it gets stored. You can graphically represent the "flow" of data through some information system, model the process aspects, create an overview of some particular system, visualize the data processing in a way of a structured design, mention the kinds of information which is being input into and output from some system as well as where the data comes from and goes to, where it is stored in a way of a data flow diagram. Making such diagram with help of Data Flow Diagrams solution, which can be found in the Software Development area of ConceptDraw Solution Park or in ConceptDraw STORE, is always very simple and the process of creating such diagram will appear to be fun and entertaining. This solution provides three vector stencil libraries developed especially for drawing the DFDs using ConceptDraw DIAGRAM diagramming and vector drawing software. The design elements library Data flow diagram (DFD) contains 15 data flow diagram symbols for drawing both context-level data flow diagram and Level 1 DFDs; the design elements library DFD, Gane-Sarson notation contains 12 data flow diagram symbols of Gane-Sarson DFD notation and the design elements library DFD, Yourdon and Coad notation contains 22 data flow diagram symbols of Yourdon/DeMarco DFD notation. Data flow diagram library contains the design symbols which represent the State, Start State, Stop State, External Interactor, Entity Relationship, Oval Process, Object, Entity, Entity (in rounded corners), Entity with ID and Location Mention (rounded corners), Data Store, Data Store (with ID) and other elements. Gane-Sarson DFD library includes the design symbols, which represent External Entity, Process, Process (with Location), Data Store, Jump, Angled Corners, Top to Bottom Variable Connector, Bottom to Side Connetor, Side to Side Connector, Side to Same Side Connector, Top to Top Side Connector, etc. Yourdon and Coad DFD library includes the design symbols, which represent Class and Object, Class, State, Generalization and specialization structure, Whole-part structure, Condition, Loop, External interactor, Data process, Multiple process, State, Multi-State, Stop State, Process, Process (offset), Center to center flow movement, Loop on center, Data store, Instance, Message and others. Use these DFD design symbol libraries for designing the process-oriented models, data-oriented models, data flowcharts, data process diagrams, structured analysis diagrams and information flow diagrams. |


Pic 2. Data Flow Diagram Software (macOS, Microsoft Windows)
No other Data Flow Diagram software gives you all this:
- Design and document using a wide range of pre-drawn data flow diagram symbols and smart connectors.
- Great value for the money, only $199 dollars.
- Free technology support.
- Free examples and built-in templates to help you draw data flow diagram rapidly.