Made with
ConceptDraw
DIAGRAM 18

Control and Information Architecture Diagrams (CIAD)
with ConceptDraw DIAGRAM

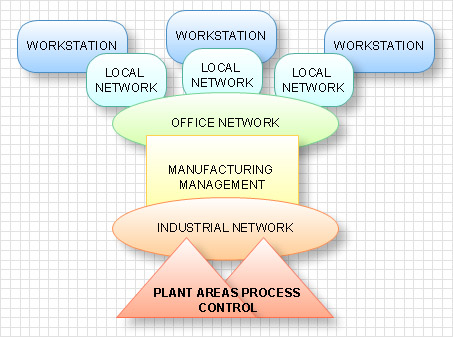
One of the three main constituents of any enterprise is the Control and Information Architecture. The rest two are Production facilities and People and Organization. The Control and Information Architecture in big organizations can be sufficiently complicated, therefore to facilitate the perception, study and analysis of this architecture the creation of diagrams which describe it in the form of graphical schemes is worthwhile. As a rule, the Control and Information Architecture Diagrams (CIAD) present the diagram series where each subsequent diagram has the higher degree of the detail elaboration. On the first level the general philosophy of the Control and Information Architecture in organization is described. Further, there can be created network diagrams presenting physical structure of data processing in organization and diagrams of entities showing the logic of data processing.

The purpose of CIAD is to present in the form of graphical schemes all objects in organization, which process data and connections between them, and also to denote the direction and consequence of data processing. CIAD show these processes analogously to Process Flow Diagrams (PFD) and similarly to PFD they are created on the projection stage.

On creation of CIAD the following should be considered:

  • On the diagram there should be presented all main calculating systems and objects which process data and lines of connections and form the organization data network.
  • Lines of connections should differ in thickness and color depending on the carrying capacity.
  • The description of the level of detailed elaboration which is described in the diagram should be presented.
  • Additional systems do not displayed on the diagram but can be mentioned in it.

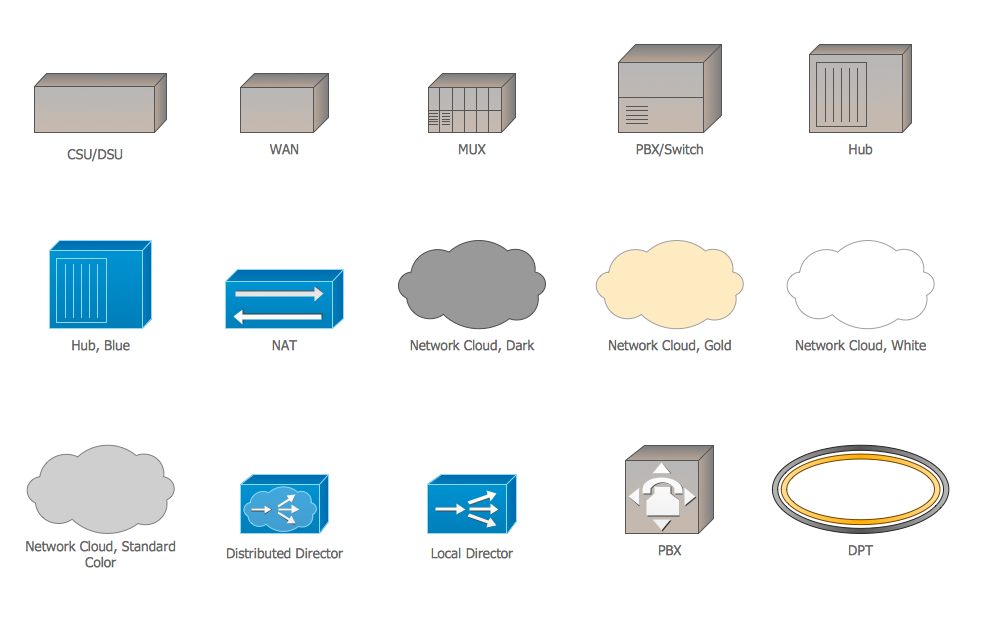
With the development of technologies and computer networks the new kind of CIAD has appeared. More detailed CIAD began to present Control and Information Network Diagram (CIND) diagrams. These diagrams in many respects are similar to CIAD but they are built on the level of servers and include the same elements as CIAD and besides them they include:

  • All the main calculating servers
  • Indications of speeds of connections’ line and connections protocols
  • Indications of all commutating devices
  • Additional calculating systems
  • All data depositories

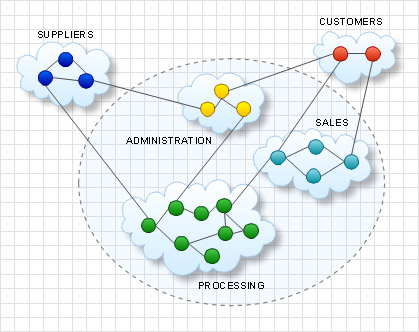
Physical structure of information architecture of an enterprise

Logic structure of information architecture of an enterprise

Control and Information Architecture Diagrams (CIAD)<br> with ConceptDraw DIAGRAM  *

TEN RELATED HOW TO's:
Garrett IA diagrams are used at development of Internet-resources, in particulars at projecting of interactions of web-resource elements. The diagram of information architecture of the web resource which is constructed correctly with necessary details presents to developers the resource in comprehensible and visual way.Garrett IA Diagrams with ConceptDraw DIAGRAM  *
Picture: Garrett IA Diagrams with ConceptDraw DIAGRAM
Network Security Architecture Diagram visually reflects the network's structure and construction, and all actions undertaken for ensuring the network security which can be executed with help of software resources and hardware devices. You dream to find powerful software for easy designing Network Security Architecture Diagram? We recommend to use ConceptDraw DIAGRAM extended with Network Security Diagrams Solution from the Computer and Networks Area of ConceptDraw Solution Park.Network Security Architecture Diagram
Picture: Network Security Architecture Diagram
Related Solution:
Use Case Diagrams technology. IDEF3 Standard is intended for description and further analysis of technological processes of an enterprise. Using IDEF3 standard it is possible to examine and model scenarios of technological processes.IDEF3 Standard *
Picture: IDEF3 Standard
It’s not easy to plan all the details of your landscape at once. Therefore, you can use a bubble diagram to create a draft of the future project. You can develop any bubble diagrams and use them in your landscape design project with ConceptDraw DIAGRAM and it’s predesigned templates. This bubble diagram can be applied while initiating the development of garden and landscape design. The bubble diagrams used for this purpose are different from the classic bubble diagrams. Being used in landscape and garden design, they obtain the quite another understanding. Bubbles in this diagram visualize some captured areas, which define the general spaces of a future garden: lawn, flower garden, pool, built-up area, lighting, etc. The bubble diagram represents the landscape project without any special expenses on its creation. It is better to make such simple sketch before you drill down into detailed project and cost estimates.Bubble diagrams in Landscape Design with ConceptDraw DIAGRAM
Picture: Bubble diagrams in Landscape Design with ConceptDraw DIAGRAM
If you need to describe some process, diagramming is a perfect tool for almost any imaginable purpose. The set of the most commonly used flow charts symbols is quite wide and includes symbols for operations, processes, data inputs and outputs. You can see the full list of all the symbols used for flowcharting in Flowcharts solution from Diagrams area in ConceptDraw Solution Park. A flow chart is often used for visual representation of a sequential process flow. The flowchart approach to any process is to divide it into some sequential actions. What makes a flow chart so popular and clear to make out is the set of standard flowchart symbols that has the same reading independently from processes described with their applying. The current drawing represents the vector library containing the pack of standard flowchart symbols. This library is supplied with ConceptDraw Flowcharts solution.Flow Chart Symbols
Picture: Flow Chart Symbols
Related Solution:
When studying a business process or system involving the transfer of data, it is common to use a Data Flow Diagram (DFD) to visualize how data are processed. Being initially used exclusively in regards to the flow of data through a computer system, now DFDs are employed as the business modeling tools. They are applied to describe the business events and interactions, or physical systems involving data storage and transfer. ConceptDraw DIAGRAM is a powerful Data Flow Diagram software thanks to the Data Flow Diagrams solution from the Software Development area of ConceptDraw Solution Park.Data Flow Diagram Software *
Picture: Data Flow Diagram Software
Related Solution:
Business Process Flow Diagram is one of the main tool of business analysis and business process re-engineering that lets identify and easy understand process flows within organization. Sign up and start today.Business Process Flow Diagram
Picture: Business Process Flow Diagram
Related Solution:
The network architecture and design specialization will help you gain the technical leadership skills you need to design and implement high-quality networks that support business needs.Computer Network Architecture. <br>Computer and Network Examples *
Picture: Computer Network Architecture. Computer and Network Examples
The innovative ConceptDraw DIAGRAM is a powerful drawing tool that changes the way diagrams are produced. While making diagrams has never been easier. This is more than enough versatility to draw any type of diagram with any degree of complexity.Making Diagrams Has Never Been Easier *
Picture: Making Diagrams Has Never Been Easier
Succeed in AWS architecture design, communication and collaboration with a team. 🔸 Create detailed and always up-to-date ✔️ AWS diagrams, ✔️ infrastructure based on AWS services, ✔️ auto-scalable architectures, ✔️ AWS-based applicationsAWS icons  2.0
Picture: AWS icons 2.0
ConceptDraw
DIAGRAM 18