Workflow Diagram Examples
Workflow Diagram
ConceptDraw DIAGRAM is simple workflow software for business process mapping. It extended with number of workflow tools alowing professionally create workflow diagrams,presentations and implement business process mapping. This is diagramming workflow tools for business process automation.
A software you use for drawing workflow diagrams should provide a wide set of examples allows you get closer with workflow diagrams, learn symbols meaning, find appropriate layout and design, and then start drawing your own workflow diagram masterfully. ConceptDraw DIAGRAM software extended with the Workflow Diagram solution provides a complete set of samples, examples, templates and features help you to draw diagrams faster. This is excelent toolkit for preparing detailed business process automation diagrams and descriptions.

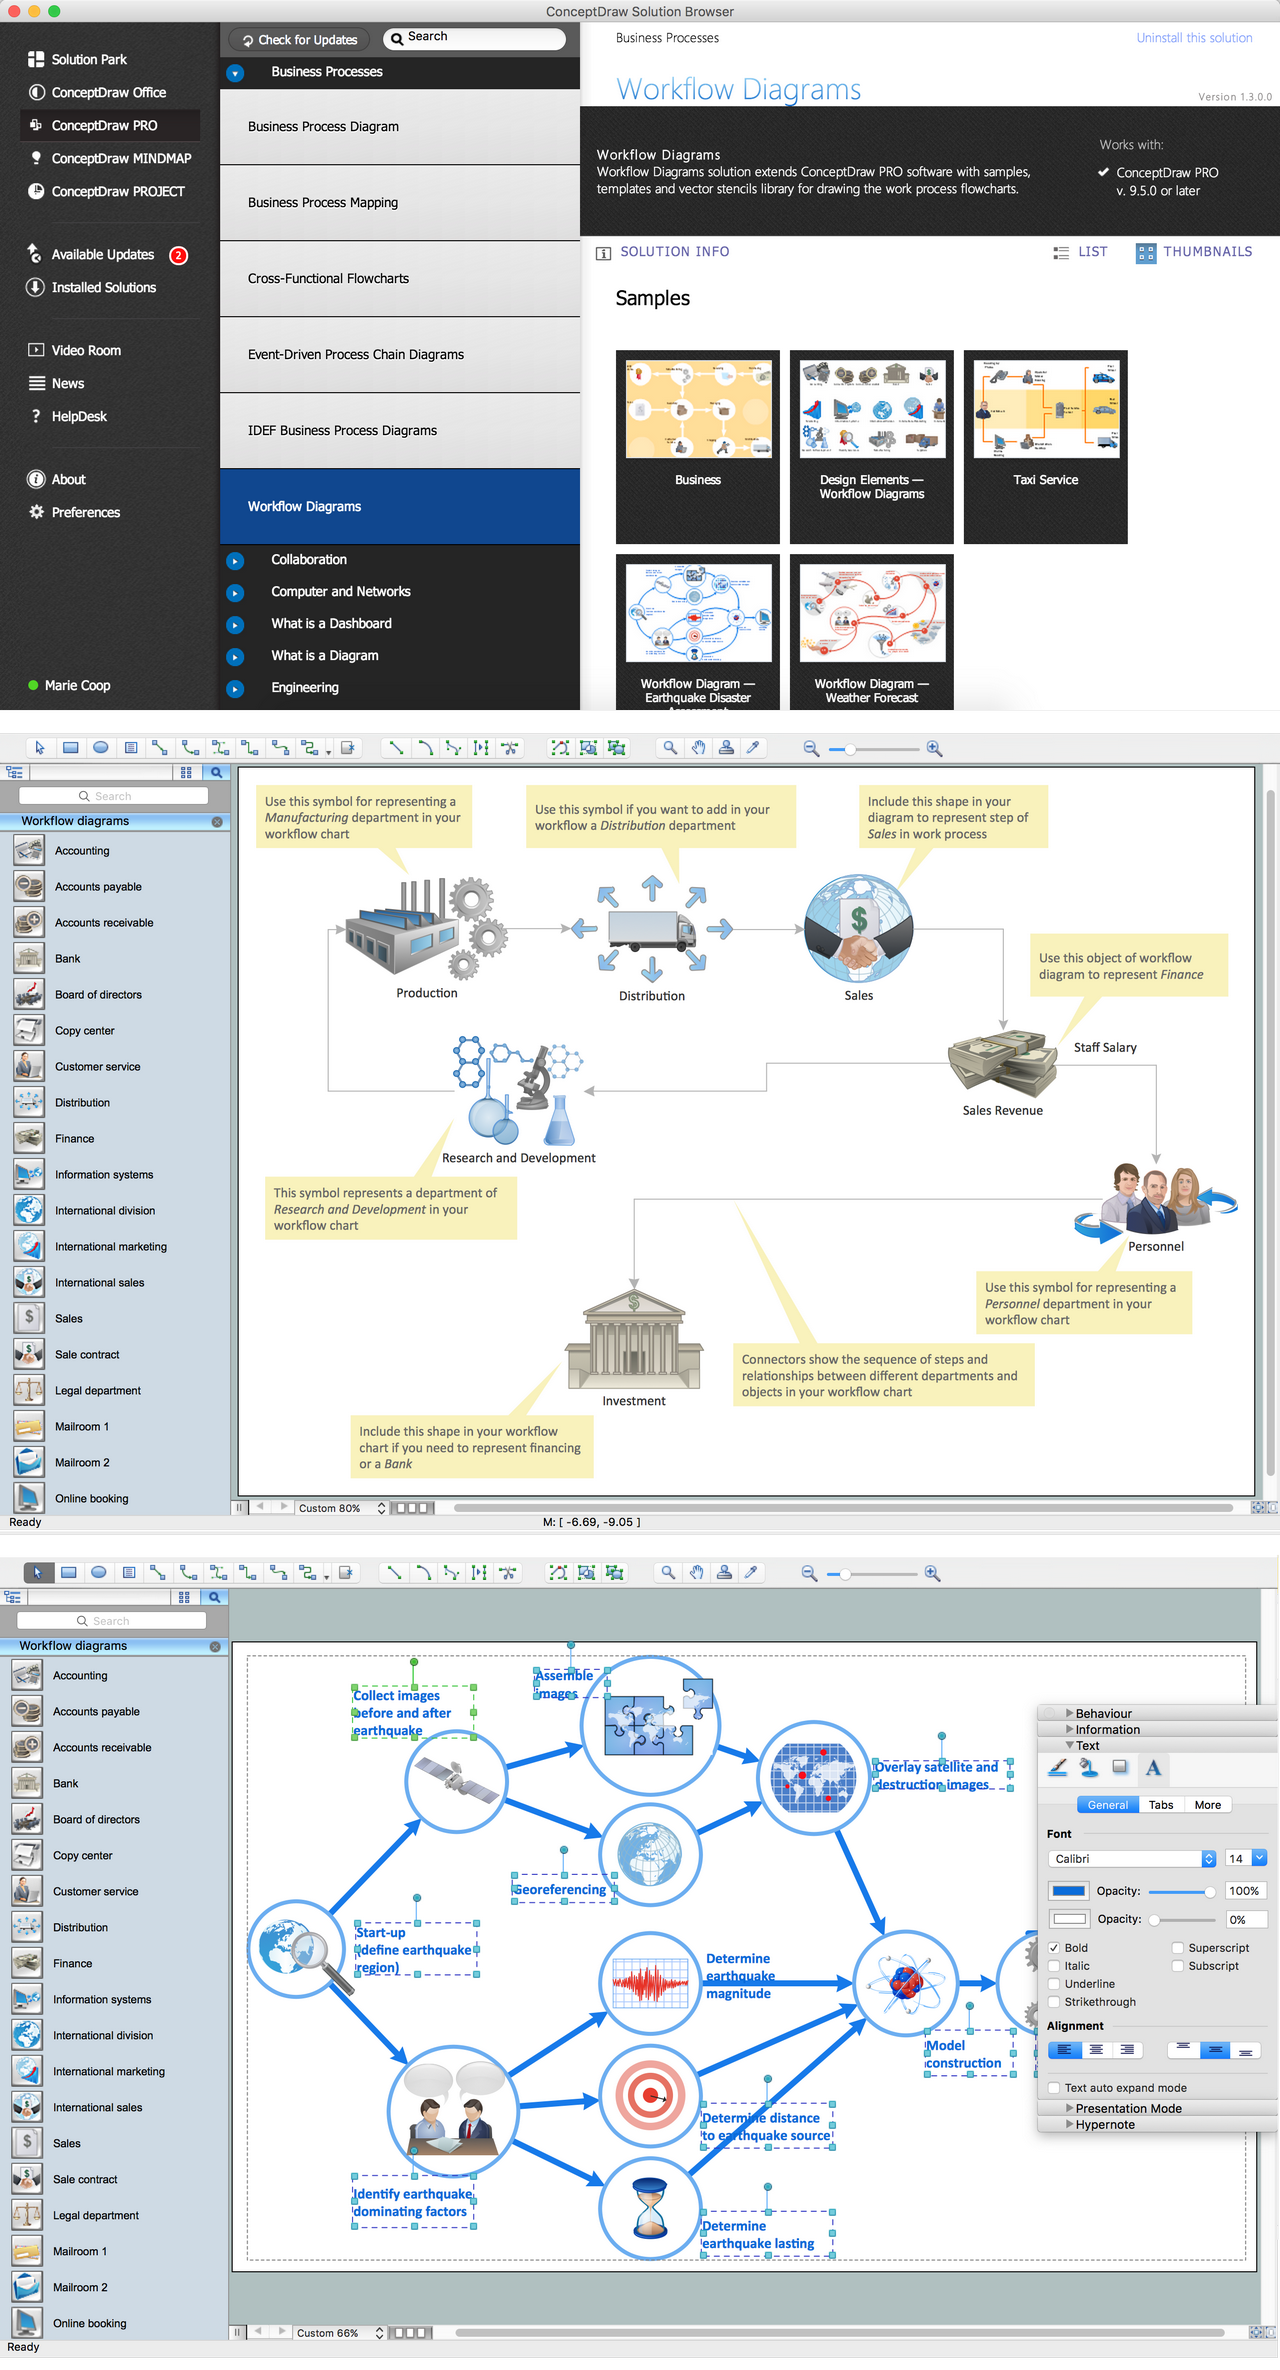
Pic.1 Workflow tools with workflow diagram template
ConceptDraw DIAGRAM is a professional diagramming software for drawing business process mapping diagrams. It includes collection of workflow tools and flowchart symbols for bpm definition.
The add on for this soft is the Workflow Diagrams solution that allow users to present business process modelling as compositon of data transferring, documents, and tasks during performance of a work process by using vector library objects and samples. They carry the simple entrance to workflow process diagram.
Pic.2 Workflow diagram examples
This example shows a workflow diagram that clearly illustrates stages a business consists of and relations between all parts of business.

Pic.3 Workflow diagram example: Business process mapping.
See also Samples:
TEN RELATED HOW TO's:
Purchasing Workflow Chart as a methods for documenting accounting information systems. Symbols and Methods for designing Accounting System.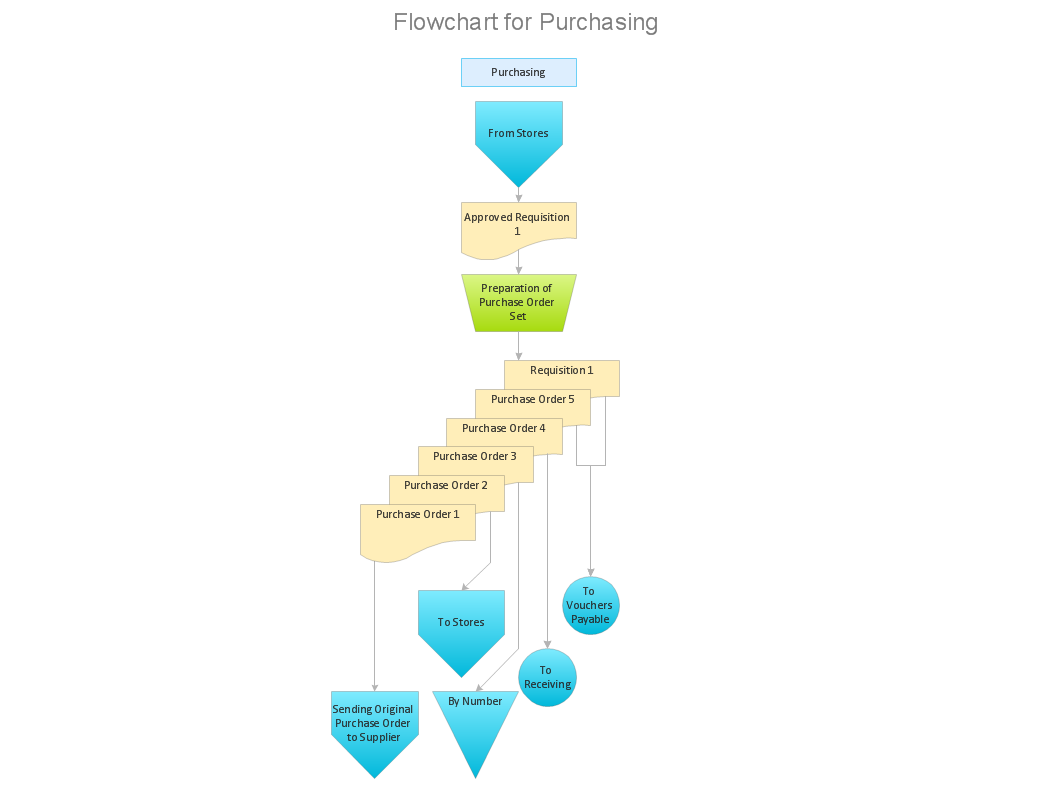
Picture: Workflow to Make a Purchase.Accounting Flowchart Example
Related Solution:
Remote Networking - We explain the method most people use to connect to the Internet.
Picture: Using Remote Networking Diagrams
This will let you create professional diagrams and charts using its simple RapidDraw option just in clicks. Take a look on a diagram you are looking for and create it fast and quickly.
Picture: Powerful Drawing Feature for Creating Professional Diagrams
This sample shows computer network diagram of the hotel service process, structure of the hotel service departments and the connection of each department to the internet using the WLAN equipment (routers, hub. etc.).
This sample was created in ConceptDraw DIAGRAM diagramming and vector drawing software using the Computer and Networks solution from Computer and Networks area of ConceptDraw Solution Park.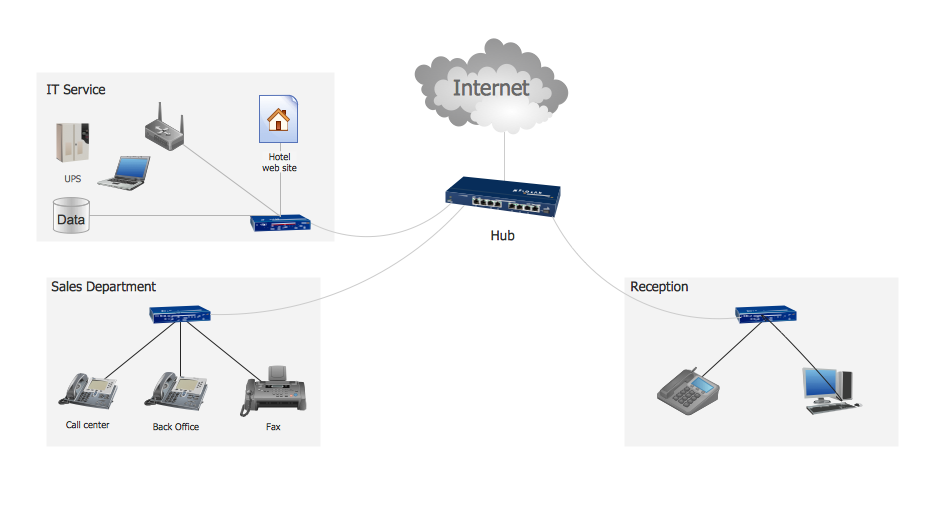
Picture: Hotel Service Process
Related Solution:
The 7 Management and Planning Tools solution implements well-known methodologies for problem analysis and solving. Different products from the ConceptDraw Office suite can be used as a complete solution for any of the methodologies in this solution. ConceptDraw Office provides visual communication during every stage of work.
Picture: 7 Management & Planning Tools
Related Solution:
To draw an effective workflow you have to have an ability to focus on thinking, not drawing. This becomes possible with ConceptDraw DIAGRAM software. Thanks to Arrows10 technology, you are able to place steps and relations onto your workflow diagram without thinking of how to do this, or which stencil to use. This is the most natural and effective way of drawing workflows.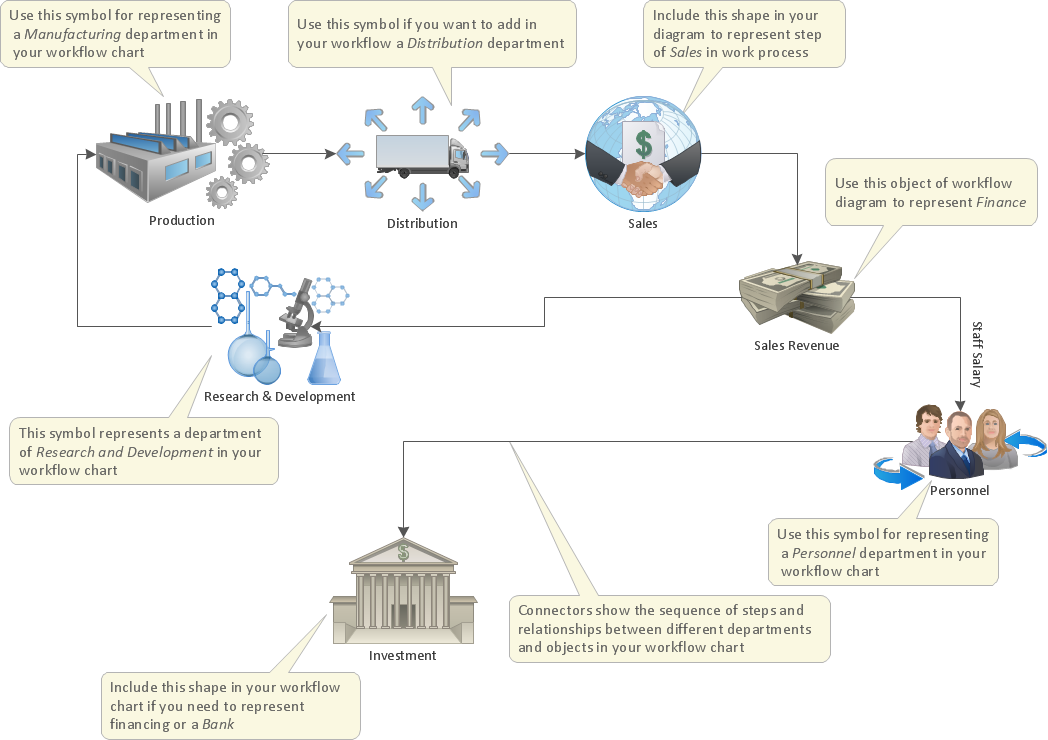
Picture: How to Draw an Effective Workflow
Related Solution:
The strategic balance is a combination of factors that can both positively and negatively affect the activity of the company. To know the factors that influence the organization success, managers should use SWOT matrix template that will define the potential inner strengths and weaknesses and potential external opportunities and threats. This matrix does not contain a ready solution, but allows to streamline all the available information.
This is a handy template of a SWOT matrix. It can serves as a visual guide for management students. To simplify the task, on the left and on the right we have added hints with examples of external and internal factors. This template one can found among numerous templates of SWOT and TOWS matrices that are included in the the eponymous solution by ConceptDraw Solution Park.
Picture: SWOT Matrix Template
Planning a water supply system is one of the stages of developing a building drawing. Although materials are constantly improved, design elements for plumbing haven't changed sufficiently for decades. This is due to necessity of maintaining very old systems.
The plan and schematic drawing of plumbing equipment, water pipe junctions and, kitchen facilities a is a rather significant element of a building plan. The suite of 4 vector libraries supplied with ConceptDraw solution for Plumbing and Piping Planning includes near 130 vector images of pipes, boilers, water pipe junctions, tanks and other plumbing devices, helpful when creating plumbing and piping plans, and blueprints of sewerage or water supply systems.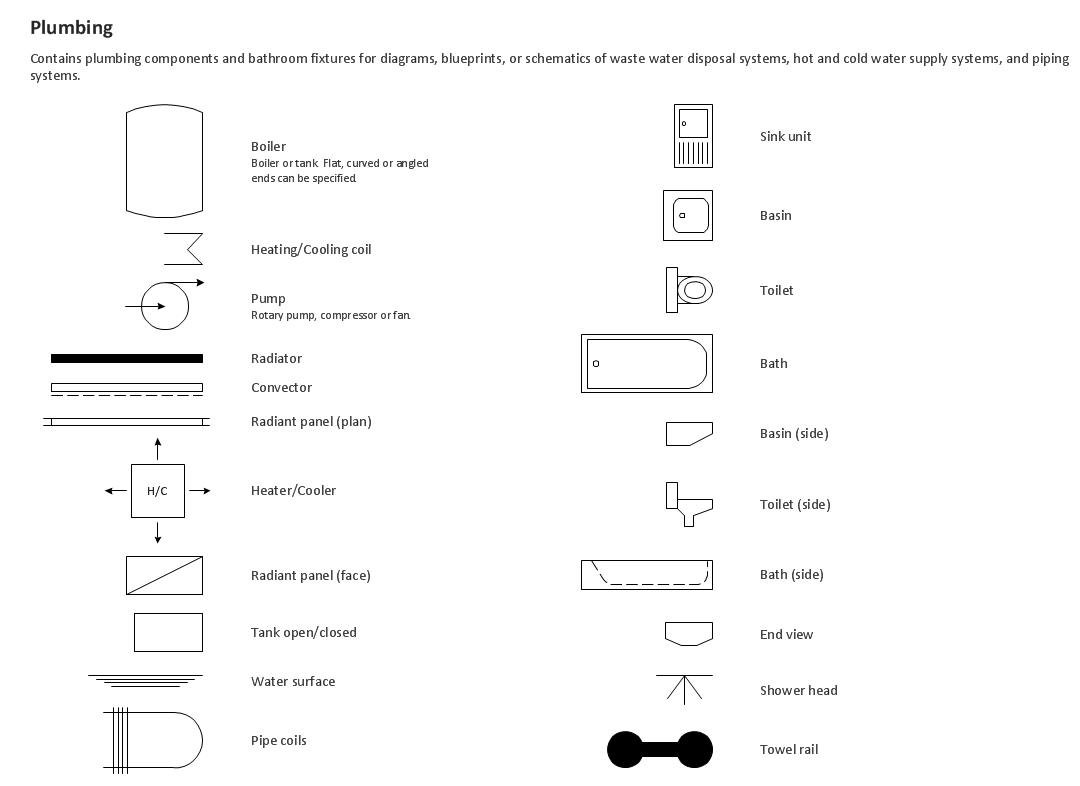
Picture: Building Drawing. Design Element — Plumbing
Related Solution:
Design efficiently the technical flow charts in ConceptDraw DIAGRAM software for various fields and provide ✔️ clarity, ✔️ accuracy, ✔️ usability, ✔️ simple communication, analysis, and improvement
Picture: Technical Flow Chart Example
Related Solution:
The ConceptDraw vector stencils library Cisco IBM contains equipment symbols for drawing the computer network diagrams.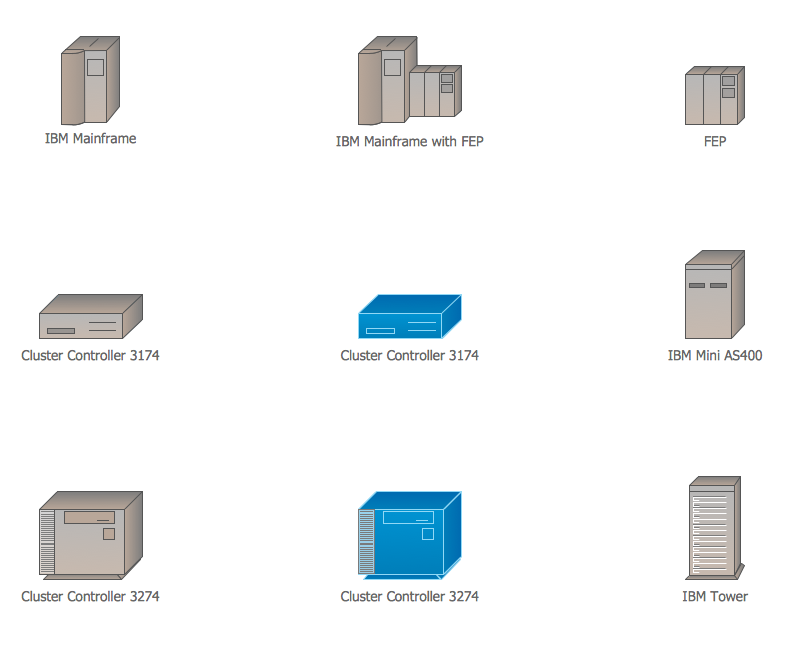
Picture: Cisco IBM. Cisco icons, shapes, stencils and symbols
Related Solution:
