Business Process Modeling Tools
BPMN
ConceptDraw DIAGRAM is a smart tool for drawing the business processes based on BPMN 2.0. The Business Process Diagram solution contains pre-designed libraries and templates based on the BPMN 2.0 standard that allows to create of both simple and complex (nested) models of processes. Remove the laborious and time intensive aspects of creating business process diagrams — ConceptDraw RapidDraw simple point-and-click design helps create professional, presentation-ready business process diagrams quickly and efficiently.
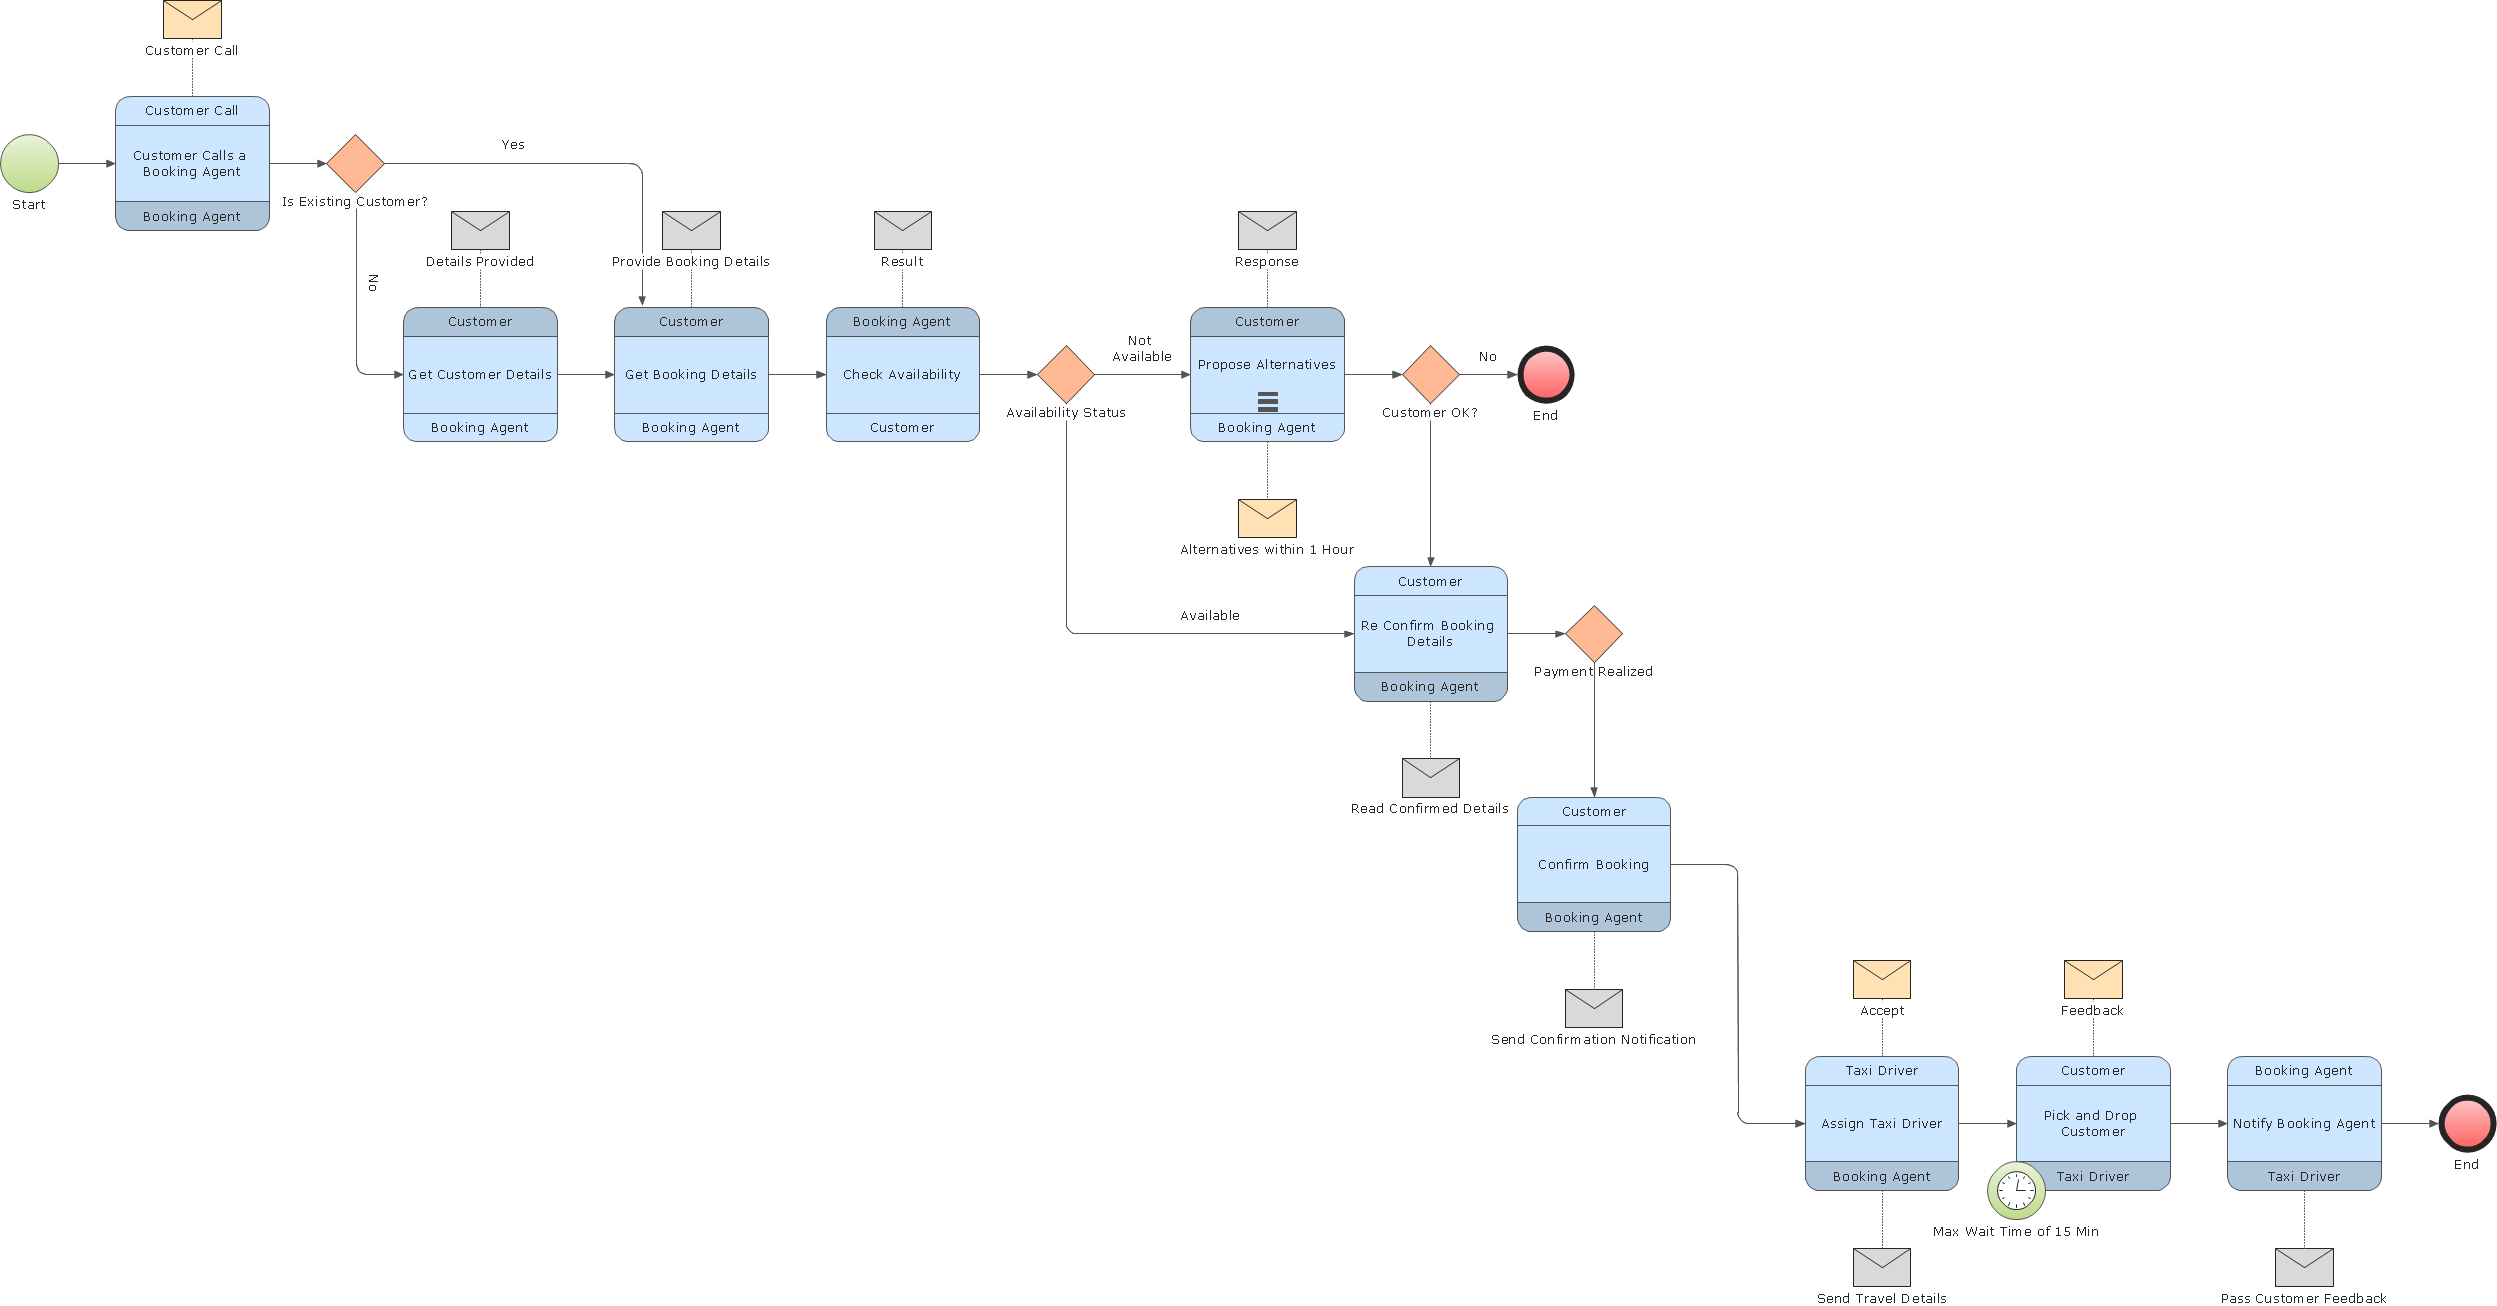
Pic.1 Choreography diagram BPMN 2.0 - Taxi reservation.
A choreography diagram defines the expected behavior between interacting participants. The choreography activities are interactions that represent a set of message exchanges which involves two or more participants. There is no central controller, responsible entity or observer of the process.
See also Samples:
TEN RELATED HOW TO's:
ConceptDraw DIAGRAM is a best business processes modeling software for graphical documenting processes of the company.
ConceptDraw has 142 vector stencils in the 8 libraries that helps you to start using Diagramming Software for designing own Business Process Diagrams.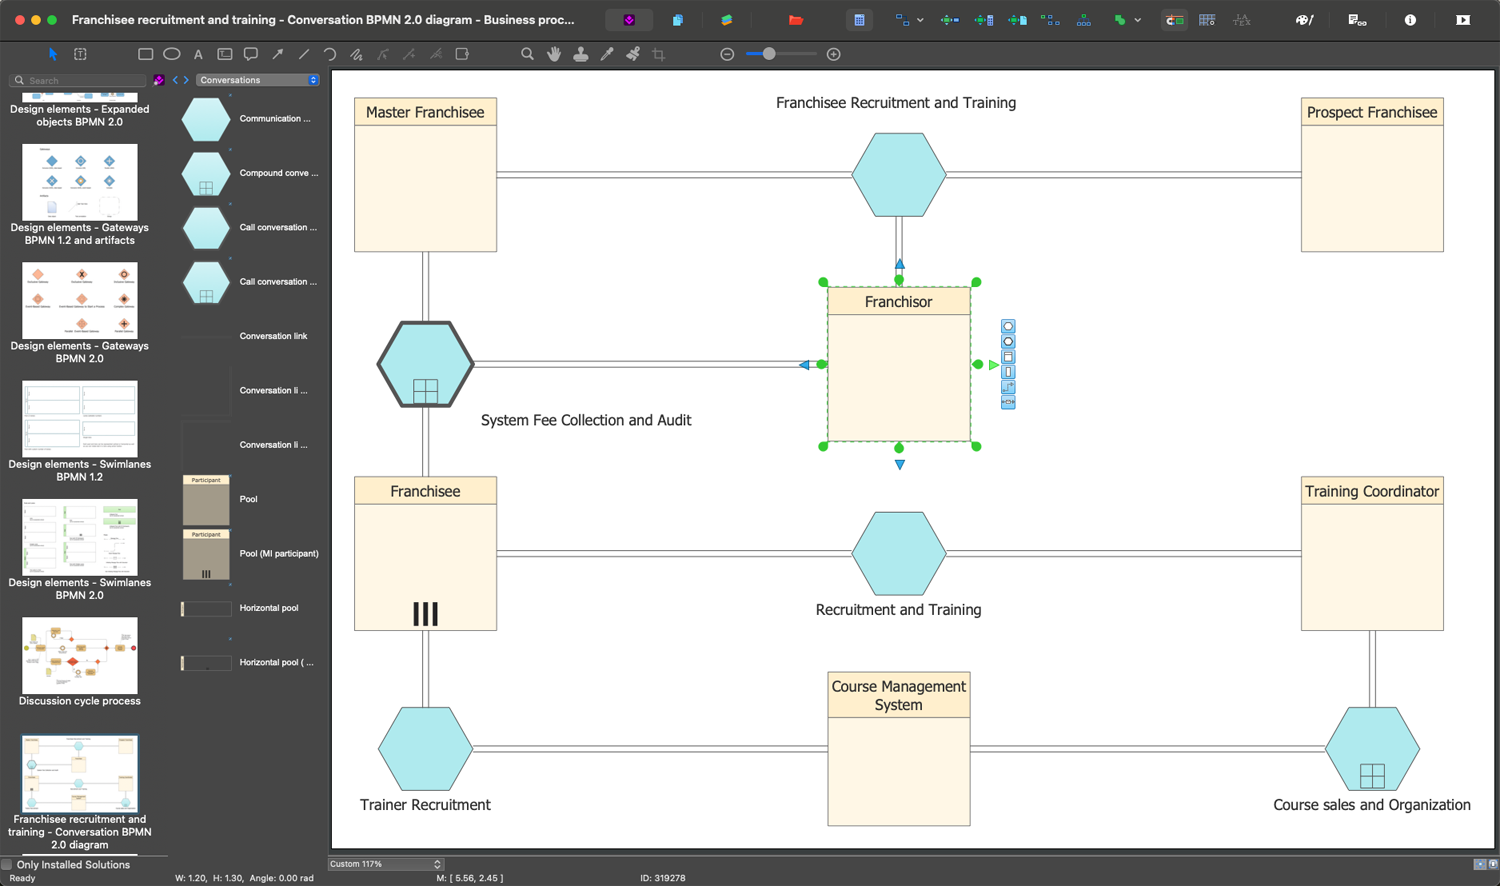
Picture: The Best Business Process Modeling Software
Related Solution:
ConceptDraw DIAGRAM is a software for simplу depicting the business processes based on BPMN 2.0.
Business Process Diagrams Cross-Functional-Flowcharts, Workflows, Process Charts, IDEF0 and IDEF2, Timeline, Calendars, Gantt Charts, Business Process Modeling, Audit and Opportunity Flowcharts and Mind Maps (presentations, meeting agendas).
Picture: Business Process Modeling Notation
Related Solution:
A flowchart maker is a software showing the interaction, sequence or organization. It also known as flowchart maker or ConceptDraw DIAGRAM standard supplied with different types of symbol collections: standard symbols, branded set and authored. It used strictly for enhancing scientific or business documents with abstract explanatory pictures.
Business graphic applications show a special knowledge representations and include many features for creating schematic pictures. These graphic tools are known as flowchart maker or flowchart maker software.
Picture: Flowchart Maker
Related Solution:
Diagramming is an astonishing way to visualize business processes. The list of the most common business process flowchart symbols is quite long starting from basic flowcharts, continuing with SIPOC diagrams. Business process modeling was never easier than now, with special ConceptDraw Business Process Mapping solution.
To carry out all professional standard requirements for business processes mapping, it is necessarily to follow the special graphical notations. ConceptDraw Business Process Mapping solution offers an exhaustive suite of tools to aid business process mapping. There are three vector libraries SIPOC Diagrams, Business Process Flowcharts, and Swim Lanes that contains totally more than 50 symbols of standard BPM notations. This is all that professionals need to effectively evaluate and manage quality in business processes.
Picture: Business Process Flowchart Symbols
Related Solution:
When trying to figure out the nature of the problems occurring within a project, there are many ways to develop such understanding. One of the most common ways to document processes for further improvement is to draw a process flowchart, which depicts the activities of the process arranged in sequential order — this is business process management. ConceptDraw DIAGRAM is business process mapping software with impressive range of productivity features for business process management and classic project management. This business process management software is helpful for many purposes from different payment processes, or manufacturing processes to chemical processes. Business process mapping flowcharts helps clarify the actual workflow of different people engaged in the same process. This samples were made with ConceptDraw DIAGRAM — business process mapping software for flowcharting and used as classic visio alternative because its briefly named "visio for mac" and for windows, this sort of software named the business process management tools.
This flowchart diagram shows a process flow of project management. The diagram that is presented here depicts the project life cycle that is basic for the most of project management methods. Breaking a project into phases allows to track it in the proper manner. Through separation on phases, the total workflow of a project is divided into some foreseeable components, thus making it easier to follow the project status. A project life cycle commonly includes: initiation, definition, design, development and implementation phases. Distinguished method to show parallel and interdependent processes, as well as project life cycle relationships. A flowchart diagram is often used as visual guide to project. For instance, it used by marketing project management software for visualizing stages of marketing activities or as project management workflow tools. Created with ConceptDraw DIAGRAM — business process mapping software which is flowcharting visio alternative or shortly its visio for mac, this sort of software platform often named the business process management tools.
Picture: Process Flowchart
Related Solution:
Flowcharts are helpful in understanding a complicated process. ConceptDraw DIAGRAM allows you to creating a simple flowchart. The ability to create flowcharts is contained in the Flowcharts solution. The solution provides a set of special tools for creating flowcharts.
Picture: Creating a Simple Flowchart
Related Solution:
ConceptDraw DIAGRAM application is perfect for creating workflow diagrams. This application contains specific features and technologies designed to draw diagrams faster, such as RapidDraw and Arrows10. ConceptDraw DIAGRAM software extended with the Workflow Diagrams solution gives you a flexible tool to draw any kind of workflow.
Picture: Workflow Application
Related Solution:
If your company is in chaos in clutter and no one understands their rights and responsibilities, maybe it's time to change that. One of the ways to put the company in order is to draw an organization chart that would reflect the structure and show the relationships among departments and positions. This is a very useful and easy to understand scheme.
This is example of the one of the most typical kind of organizational chart. It depicts an organizational structure of the hierarchical type. Its construction is similarv to pyramid. The single main position on the top - in this case, the mayor's position followed by sub-levels of authority in his command. Each position in the pyramid reports only to his supervisor, and takes only a report of direct subordinates. Such scheme limits the number of communications. This organizational structure is effectively used in public organizations. Also it is suitable for any organization with the need for multiple levels of middle managers. The ability to create organizational charts of different types is supplied with ConceptDraw Ogrcharts solutions.
Picture: How to Draw an Organizational Chart
Related Solution:
A flowchart is a simple but very functional tool when it comes to understanding a workflow or to removing unnecessary stages from a process. When drawing flowcharts, keep in mind that there are four common types of flowcharts, like document flowcharts and data flowcharts that show control over a data or document flow over a system. To show controls on a physical level, use system flowcharts. In addition, to show controls in a program, you can draw a program flowchart.
This flowchart diagram represents the piece of an article editing process, that involves the author and editor. It was created using the Basic Flowchart notation that consists from the basic flowchart symbols. The start and the end of the process are indicated with "Terminator" symbols. The "Process" symbols show the action steps consisting from making edits and searching for a compromise, when the author does not agree with the suggestions of the editor. The "Process" symbol is the general symbol in process flowcharts. The "Decision" symbol indicates a branching in the process flow. There are two branches indicated by a Decision shape in the current flowchart (Yes/No, Disagree/Agree). This basic flowchart can be used as a repeating unit in the workflow diagram describing the working process of some editorial office.
Picture: Types of Flowcharts
Related Solution: