Milestone Chart

Milestone Chart
Milestones are a useful and high-effective tool in project management, they help mark the control points or important key moments in the course of projectHow to Report Task's Execution with Gantt Chart *

How to Report Task's Execution with Gantt Chart
ConceptDraw Project Gantt chart reports gallery
Timeline charts presents events and time periods on a chronological scale. They are used in project management to visualize project milestones and upper level

The PERT chart shows the logical connections and consequence of a set of tasks. PERT charts the time period for problem solving and the implementation plan

HelpDesk
Change the Timescale in a Gantt Chart View. ConceptDraw HelpDesk
Most views in ConceptDraw PROJECT Server have a timescale that shows the units of project time measurement (hour, day, week, etc.) used to schedule project tasks. You can change the timescale to view smaller or bigger time units, from hours all the way up to years. For example, you may want to show time in quarterы of the yearб or you may want to show Gantt chart across months and days.
 Timeline Diagrams Solution. ConceptDraw.com
Timeline diagram is the best broad overview of a sequence of project events and steps in time. This template is a perfect base for designing the Project

HelpDesk
Creating a Timeline Diagram . ConceptDraw HelpDesk
How to Create a Timeline Diagram · Run ConceptDraw DIAGRAM . · Reveal the Timeline Diagram solution in the Solutions panel. · You can start with opening template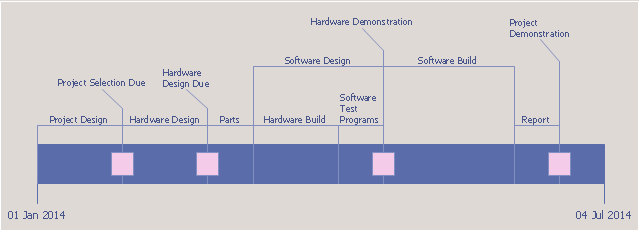
Timeline charts presents events and time periods on a chronological scale. They are used in project management to visualize project milestones and upper level

HelpDesk
How to Create Project Diagrams on a Mac. ConceptDraw HelpDesk
Milestones chart , PERT chart , Radial Structure chart , Resource Calendar, Resource Usage diagram , Timeline, Timeline From Marked Tasks, and WBS chart . The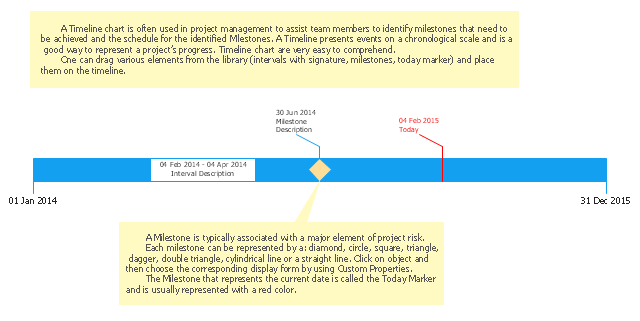
Timeline charts presents events and time periods on a chronological scale. They are used in project management to visualize project milestones and upper
.png--diagram-flowchart-example.png)
chart example "Request for proposal (RFP)" was created using the PERT. PERT. PERT, time interval, task, project start, project finish, milestone ,
Radar Chart

Radar Chart
Each axis on the Radar Chart represents one chain of linked milestones , the number of marks on the axis corresponds to the number of project milestones . All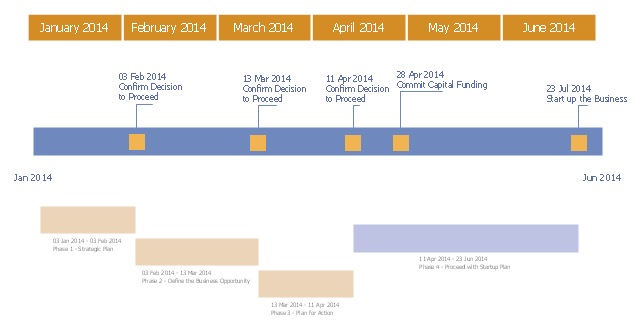
"A project plan, according to the Project Management Body of Knowledge, is: " a formal, approved document used to guide both project execution and project
 Project Management Dashboards Solution. ConceptDraw.com
The PM Dashboards solution extends the management boundaries of ConceptDraw DIAGRAM and ConceptDraw PROJECT products with an ability to demonstrate changes

HelpDesk
Drawing a Project Gantt Chart . ConceptDraw HelpDesk
milestones , calendars, and also resource usage. Gantt chart — is one of the most convenient and popular types of graphical representation of task time. OnePERT Chart

PERT Chart
PERT Charts are widely applied in the projects where time rather than cost is a major factor. They help diagram the workflows, project lifecycles, milestones ,
How to Make a Timeline *

How to Make a Timeline
How to Make a TimelineWhat is Gantt Chart (historical reference) *
 *")
What is Gantt Chart (historical reference)
Gantt chart example - Strategic plan for hew business- Milestone Chart
- PERT chart - Template | Timeline Diagrams
- How to Identify Project Milestones | How to Create a Timeline ...
- Design elements | How to Create a Timeline Diagram
- How to Report Task's Execution with Gantt Chart | Milestone Chart
- How to Create a Timeline Diagram | Design elements - Timelines ...
- Project Timeline | Timeline Examples | Timeline Diagrams ...
- Design elements - Timelines and milestones | Timeline Diagrams
- How to Create a Timeline Diagram in ConceptDraw PRO | Visio ...
- Project Milestone Example - Timeline Diagrams