
HelpDesk
Creating a Timeline Diagram. ConceptDraw HelpDesk
A Timeline is a chart which displays a project plan schedule in chronological order. A Timeline is used in project management to depict project milestones
 Timeline Diagrams Solution. ConceptDraw.com
A widespread is the use of Timeline Diagrams in a field of project management, where they allow to visualize the steps of the business project , important

HelpDesk
How to shift dates in project. ConceptDraw HelpDesk
You can shift the task in the project schedule through the timescale by dragging the bars in the Gantt window using the mouse. If you need to shift all dates,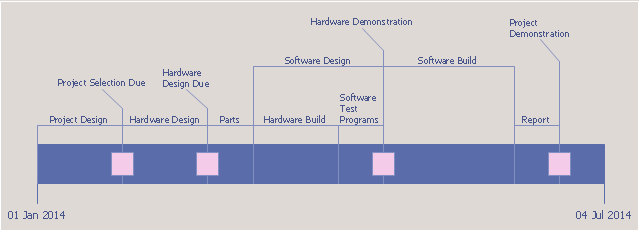
Timeline charts presents events and time periods on a chronological scale. They are used in project management to visualize project milestones and upper level

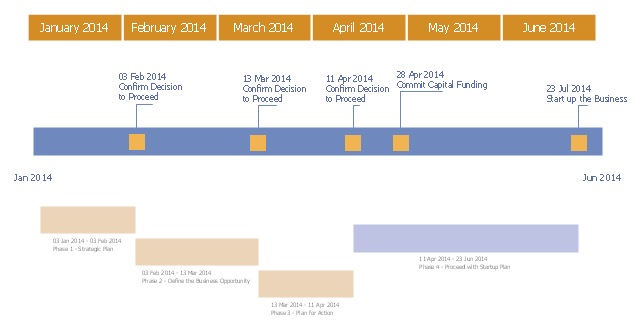
"A project plan , according to the Project Management Body of Knowledge, is: " a formal, approved document used to guide both project execution and project

HelpDesk
Creating Project Gantt Chart. ConceptDraw HelpDesk
ConceptDraw PROJECT uses Gantt Charts to display project tasks and timelines . Gantt Charts are capable of displaying a large amount of highly detailed.png--diagram-flowchart-example.png)
"The RFP presents preliminary requirements for the commodity or service, and may dictate to varying degrees the exact structure and format of the supplier's
Timeline charts presents events and time periods on a chronological scale. They are used in project management to visualize project milestones and upper
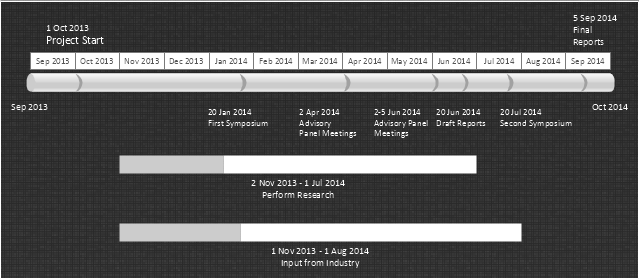
"In project management, a schedule is a listing of a project's milestones, activities, and deliverables, usually with intended start and finish dates.

HelpDesk
How to Track Your Project Plan vs. the Actual Project Condition
ConceptDraw PROJECT allows following how the project is going. You can easily compare the actual project data with the planned ones.
HelpDesk
Create Project Plan From Mind Map. ConceptDraw HelpDesk
MINDMAP Diagrams solution provides mind map templates and samples for building Venn diagrams, Onion charts, Matrixes, and some other charts.
HelpDesk
How to Create a Multi- Project Schedule on Mac. ConceptDraw
ConceptDraw PROJECT lets you group separate projects into a multiproject that can share a common resource pool and a synchronized task schedule.
"A timeline is a way of displaying a list of events in chronological order, sometimes described as a project artifact. It is typically a graphic design showing

HelpDesk
Project tasks list columns. ConceptDraw HelpDesk
CP — Tasks, marked in this column make a project's critical path. Custom Mark — Indicates tasks marked to be used in the Timeline from Marked Tasks report.How to Make a Timeline *

How to Make a Timeline
How to Make a Timeline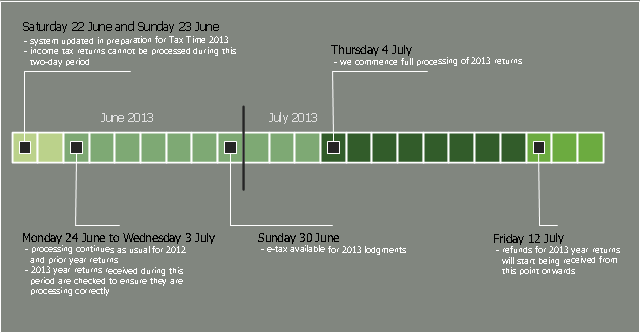
This timeline diagram sample was created on the base of the figure illustrating the webpage "Preparing for Tax Time 2013" from the website of the Australian
Product Overview *

ConceptDraw PROJECT Product Overview
ConceptDraw PROJECT input/output capabilities
Timeline charts presents events and time periods on a chronological scale. They are used in project management to visualize project milestones and upper level

HelpDesk
How to Create Project Diagrams on a Mac. ConceptDraw HelpDesk
Timeline , Timeline From Marked Tasks, and WBS chart. The diagram will be generated in ConceptDraw DIAGRAM format (CDDZ). Open a project file. Click the- Design elements - Timelines and milestones | Design elements ...
- Project Timeline | Timeline Examples | How to Make a Timeline ...
- Timeline Examples | Project Timeline | Timeline Diagrams | Visio ...
- How to Identify Project Milestones | How to Create a Timeline ...
- Project Timeline | How to Create a Timeline Diagram | Timeline ...
- Project plan timeline - Request for proposal (RFP) | Project Timeline ...
- Timeline Examples | Project Timeline | How to Make a Timeline ...
- Timeline Diagrams | How to Create a Timeline Diagram | Timeline ...
- Project Timeline | How to Create a Timeline Diagram | Timeline ...
- Project Timeline | Timeline Examples | How to Make a Timeline ...