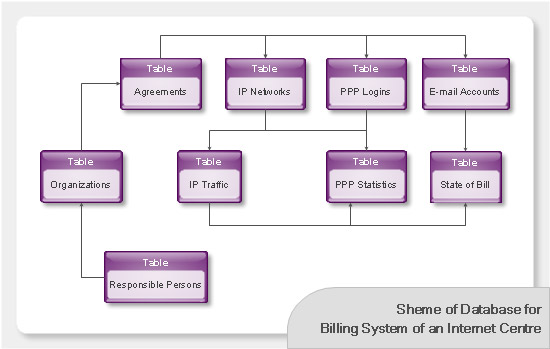
Data structure diagram with ConceptDraw DIAGRAM

Databases Access Objects Model with ConceptDraw DIAGRAM
 ConceptDraw Solution Park
ConceptDraw Solution Park collects graphic extensions, examples and learning materials
HelpDesk
How to Create an Entity-Relationship Diagram

 Data Flow Diagrams (DFD)
Data Flow Diagrams solution extends ConceptDraw DIAGRAM software with templates, samples and libraries of vector stencils for drawing the data flow diagrams (DFD).
Software development with ConceptDraw DIAGRAM

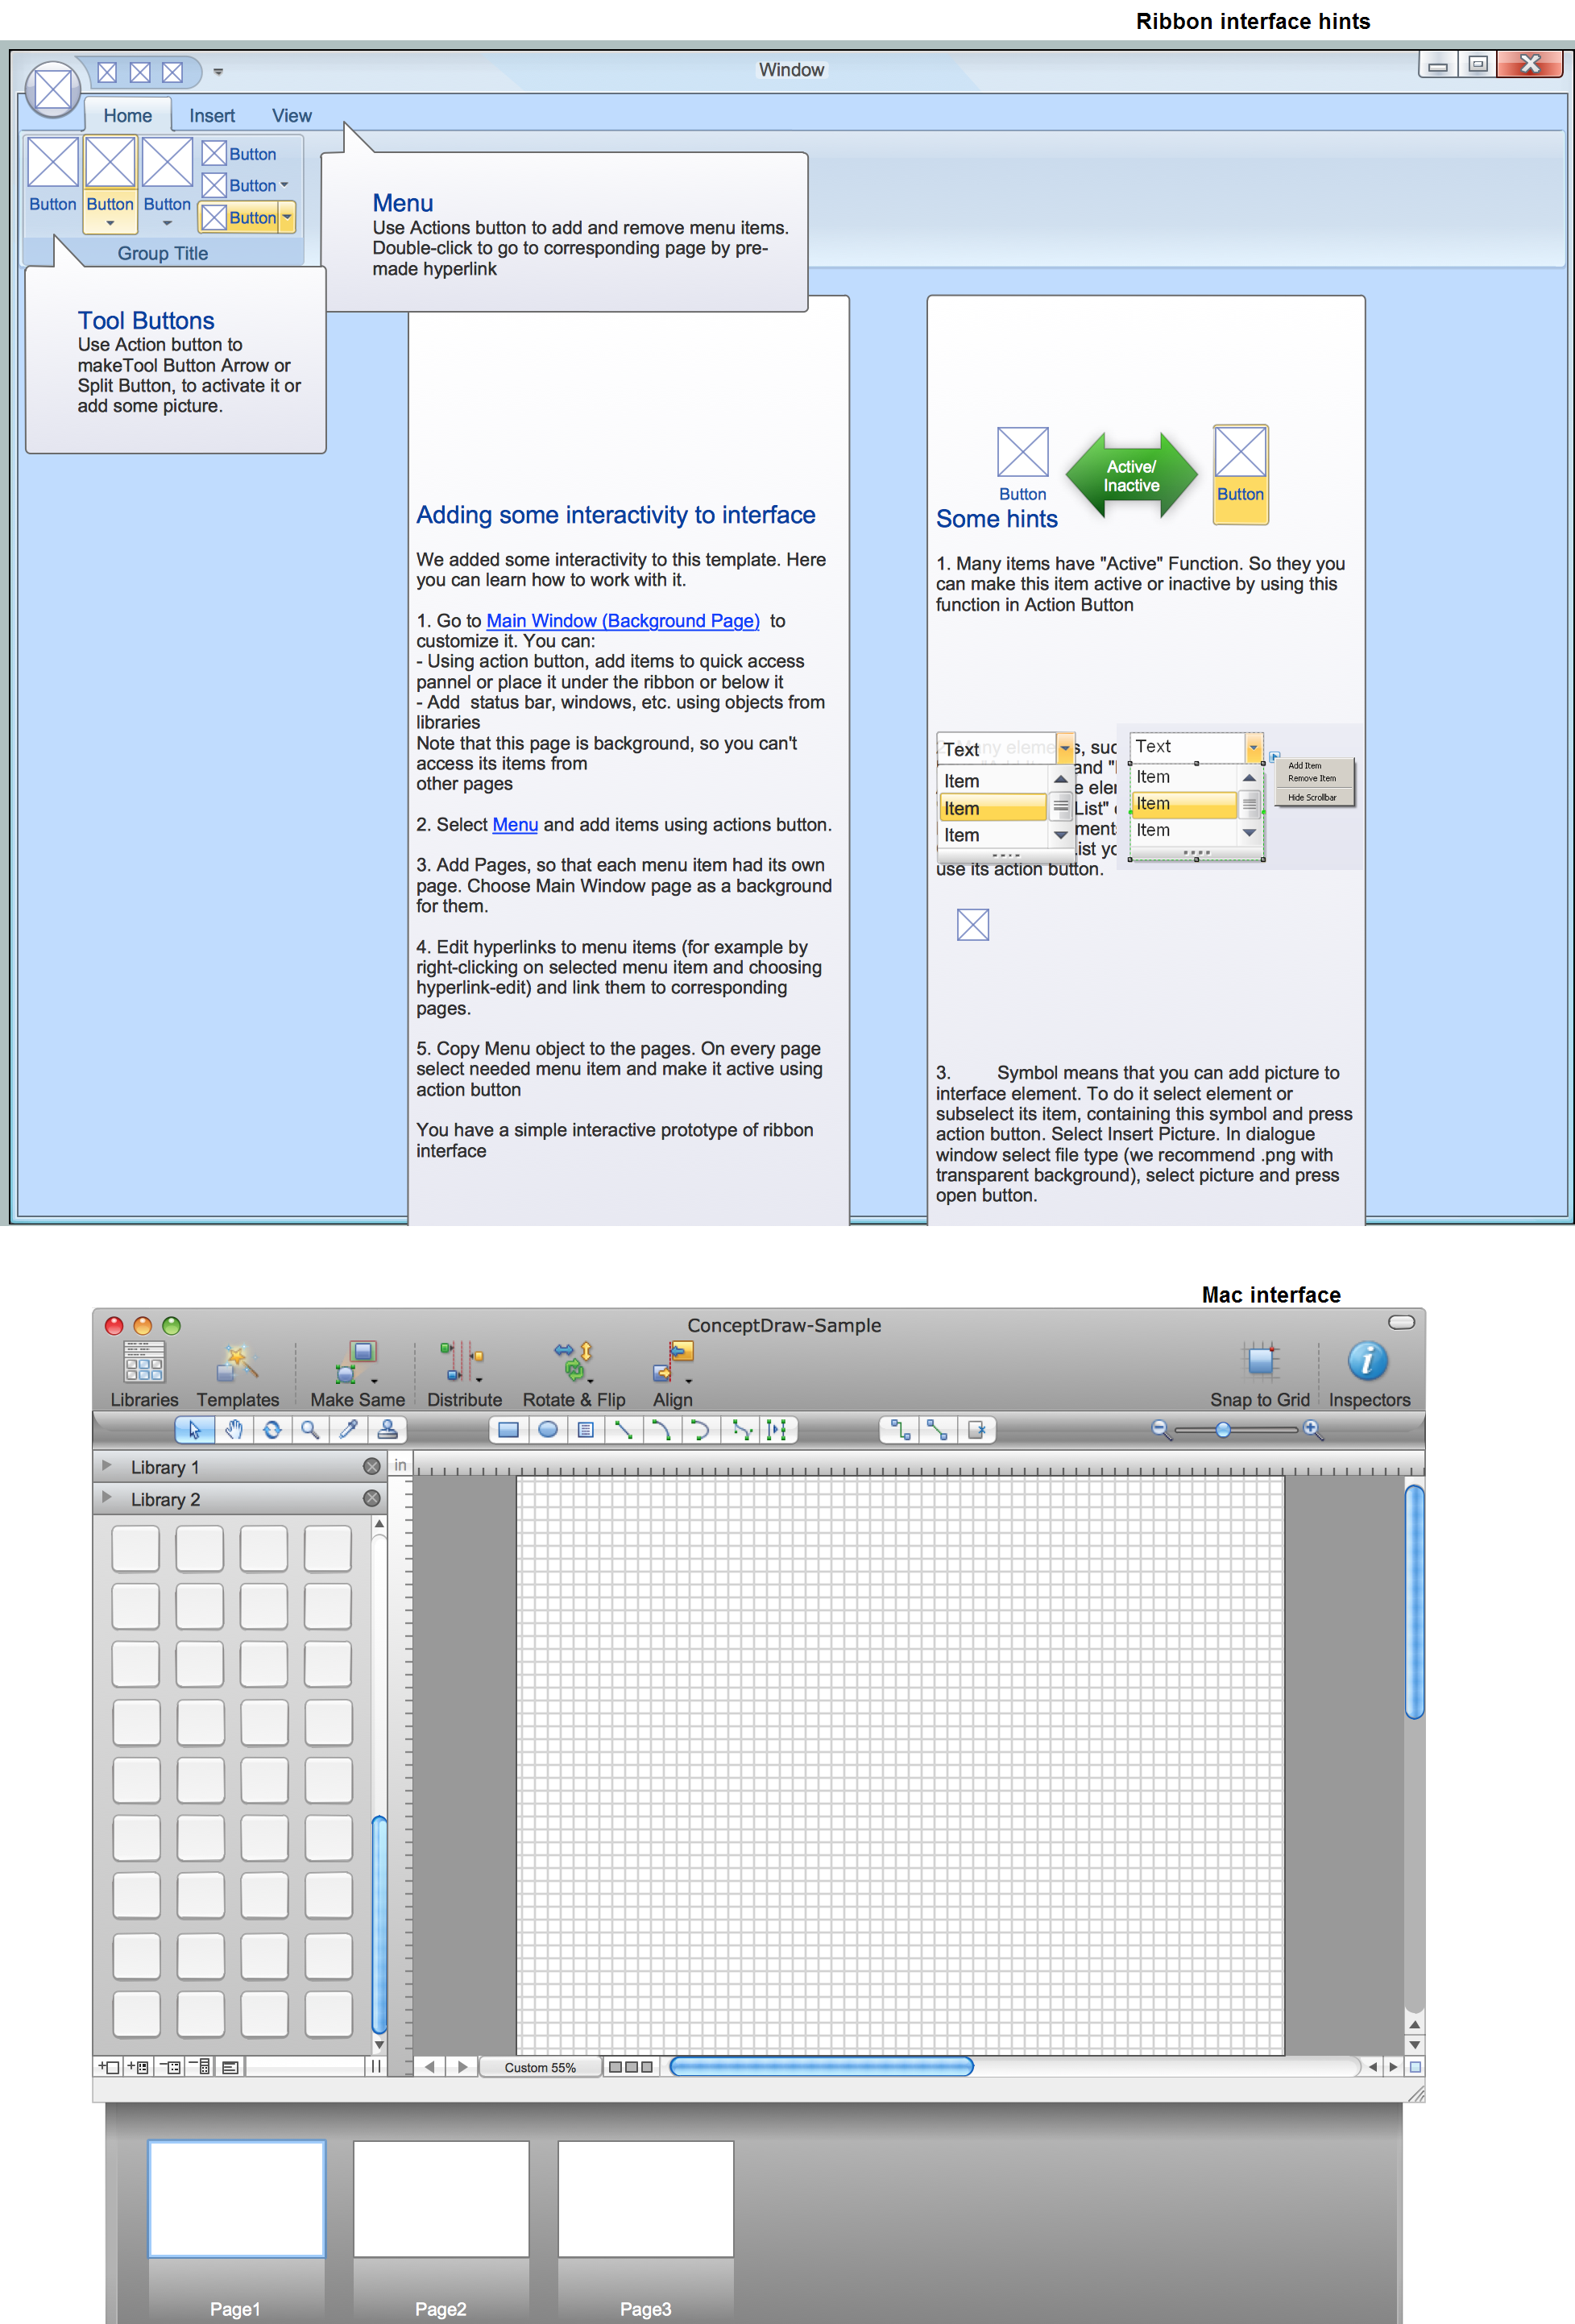
GUI Prototyping with ConceptDraw DIAGRAM
Applications

ConceptDraw DIAGRAM Database Modeling Software

HelpDesk
Event-driven Process Chain (EPC) Diagram Software

HelpDesk
How to Connect a Live Object to a Text Data Source

- Data modeling with ConceptDraw PRO | Data Modeling with Entity ...
- Data modeling with ConceptDraw PRO | Process Flowchart ...
- ConceptDraw PRO Database Modeling Software | ConceptDraw ...
- Data modeling with ConceptDraw PRO | Structured Systems ...
- Data structure diagram with ConceptDraw PRO | Data Modeling ...
- ConceptDraw PRO ER Diagram Tool | ConceptDraw PRO Database ...
- Rapid UML | Total Quality Management with ConceptDraw | Data ...
- Data modeling with ConceptDraw PRO | IDEF1 standard | IDEF1X ...
- Visualizing a FileMaker database with ConceptDraw PRO ...
- Data structure diagram with ConceptDraw PRO | ConceptDraw PRO ...
- Data Flow Diagrams with ConceptDraw PRO
- Modelling Concepts for Business Engineering - EPC | Data ...
- Databases Access Objects Model with ConceptDraw PRO ...
- ConceptDraw PRO Database Modeling Software | Data Flow ...
- ConceptDraw PRO Database Modeling Software
- Data structure diagram with ConceptDraw PRO | Program Structure ...
- Data Modeling with Entity Relationship Diagram | ConceptDraw ...
- ConceptDraw PRO ER Diagram Tool | ConceptDraw PRO Database ...
- Data structure diagram with ConceptDraw PRO | UML Diagrams ...
- Data structure diagram with ConceptDraw PRO | Bubble diagrams ...