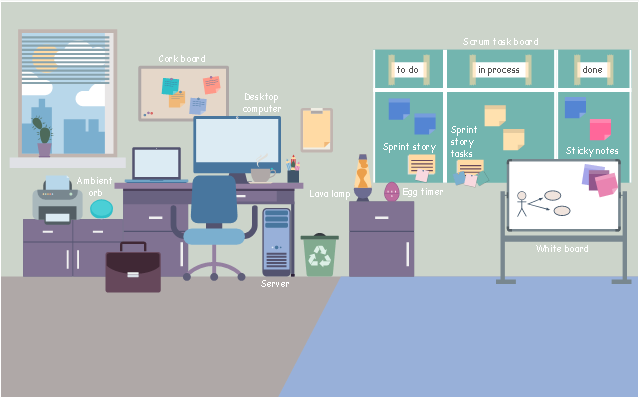
This agile software development infographic example was inspired by Mike Cohn's post "The Ideal Agile Workspace" from the Mountain Goat Software blog.
"... a list of all the things that ... should be visible within the ideal agile workspace:
* Big Visible Charts. ... the sprint burndown chart, showing the number of hours remaining as of each day of the current sprint. ... big visible charts showing the number of passing customer acceptance tests, the pass/ fail status of tests by day, sprint and release burndown charts, number of new stories introduced to the product backlog per sprint ...
* Additional feedback devices. ... a lava lamp that is turned on whenever the automated build is broken. ... flashing red traffic lights to indicate exceptional conditions such as an issue on a production server. ... ambient orbs and Nabaztag rabbits, which are wireless programmable devices that can also be configured to change colors, speak messages, or wiggle their ears as a team desires.
* Everyone on your team. Each person on the team should ideally be able to see each other person on the team. ...
* The sprint backlog. ... The best way to do that is by displaying the sprint backlog on a wall, ideally in the form of a task board A task board is usually oriented in rows and columns with each row containing a particular user story and one index card or sticky note for each task involved in that story. Task cards are organized in columns, minimally including “To Do” “In Process,” and “Done.” ...
* The product backlog. ... tack the index cards with those upcoming user stories on a wall where all can see them. ...
* At least one big white board. ...
* Someplace quiet and private. ...
* Food and drink. ...
* A window." [mountaingoatsoftware.com/ blog/ the-ideal-agile-workspace].
The infographic sample "Scrum workspace" was created using the ConceptDraw PRO software extended with the Scrum solution from the Project Management area of ConceptDraw Solution Park.
The vector stencils library "Scrum workspace" contains 21 icons.
Use this clipart set to design your agile software development diagrams and infographics with ConceptDraw PRO software.
"... a list of all the things that ... should be visible within the ideal agile workspace:
Big Visible Charts. ... the sprint burndown chart, showing the number of hours remaining as of each day of the current sprint. ... big visible charts showing the number of passing customer acceptance tests, the pass/ fail status of tests by day, sprint and release burndown charts, number of new stories introduced to the product backlog per sprint, and more.
Additional feedback devices. In addition to big, visible charts, it is common for an agile team to use additional visual feedback devices in their workspace. One of the most common is a lava lamp that is turned on whenever the automated build is broken.
... flashing red traffic lights to indicate exceptional conditions such as an issue on a production server. Also popular are ambient orbs and Nabaztag rabbits, which are wireless programmable devices that can also be configured to change colors, speak messages, or wiggle their ears as a team desires. ...
Everyone on your team. Each person on the team should ideally be able to see each other person on the team. This absolutely includes the ScrumMaster and ideally includes the product owner. ...
The sprint backlog. One of the best ways to ensure that everything necessary is completed in the sprint is to make the sprint backlog visible. The best way to do that is by displaying the sprint backlog on a wall, ideally in the form of a task board ...
The product backlog. One problem with running an endless series of sprints is that each can feel disconnected or isolated from the whole of a planned released or related set of new capabilities. A good way to reduce the impact of this problem is by displaying the product backlog somewhere clearly visible. ... tack the index cards with those upcoming user stories on a wall where all can see them. This allows team members to see how the user stories they are working on in the current sprint relate to others that are coming soon.
At least one big white board. ... Locating this in the team’s common workspace encourages spontaneous meetings." [mountaingoatsoftware.com/ blog/ the-ideal-agile-workspace]
The clip art sample "Design elements - Scrum workspace" is included in the Scrum solution from the Project Management area of ConceptDraw Solution Park.
Subway infographic design elements - software tools
Subway infographic design elements of MetroMap and ConceptDraw software tools.HelpDesk
How to Draw an Organizational Chart Using ConceptDraw PRO
The organizational chart software is a valuable tool for modern business. It is important for any business to build a clear organizational structure that determines the responsibilities and relationships between different positions in the organization. The clear structured organization - means the clear structured business workflow, which is the core of success in the business. ConceptDraw PRO is an org chart software that allows you to draw an organizational structure of your company quickly and easily.
 Scrum Workflow
The Scrum Workflow Solution extends the capabilities of ConceptDraw PRO 10 with a large collection of professionally-designed samples and a selection of ready-to-use scrum design elements: scrum diagrams and arrows, scrum icons of people, artifacts, workflow, workspace and other colorful scrum clipart, and also scrum charts.
 PM Personal Time Management
This solution extends all ConceptDraw Office 2.0 products providing every project participant with a track timeframe, workspace and role in a project with the help of Microreports, calendars, and to-do lists.
Scrum
What is Scrum? Scrum is the famous agile software development methodology which depicts an iterative and incremental approach for the work on the complex projects. Use ConceptDraw PRO diagramming and vector drawing software extended with SCRUM Workflow solution to draw various types of professional-looking Scrum Charts, Scrum Workflow Diagrams, Scrum Mind Maps, Scrum boards and attractive Scrum Infographics.HelpDesk
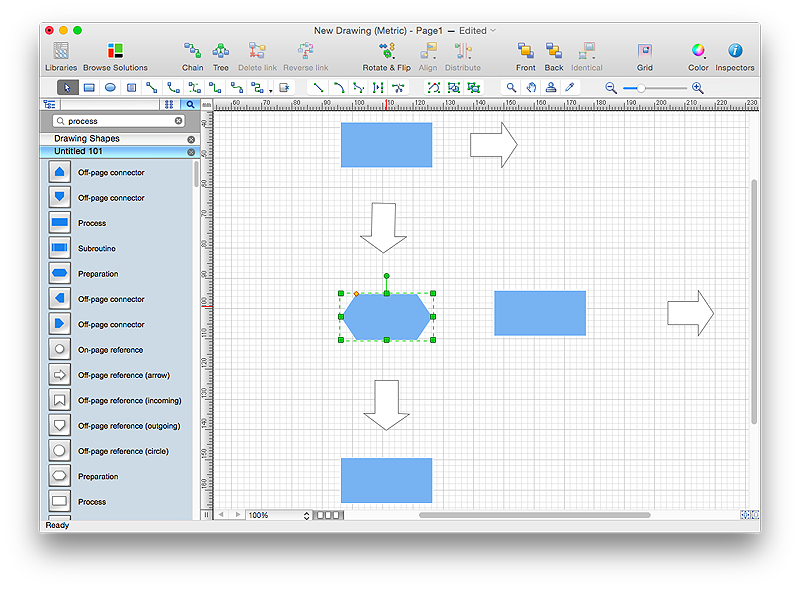
How to Draw a Process Flow Diagram in ConceptDraw PRO
Process Flow diagrams are used in chemical and process engineering to show the flow of chemicals and the equipment involved in the process. When it comes to creating a process flow diagram, it's important to use software that is capable of describing a wide range of processes, using techniques and graphical notation that are easily recognized by engineering workers. An ideal drawing platform will utilize functions that can cope with the output of a high volume of engineering processes, that may change rapidly from development to implementation stages. ConceptDraw PRO, with the extended functionality of the Chemical and Process Engineering Diagrams solution, is the ideal medium for creating designs of this type. The Chemical and Process Engineering Diagrams solution complements this feature with a library of selected icons to represent various steps — all instantly recognizable and applicable to a wide user base. ConceptDraw PRO allows you to draw the Process Flow diagram easily using the set of special libraries.HelpDesk
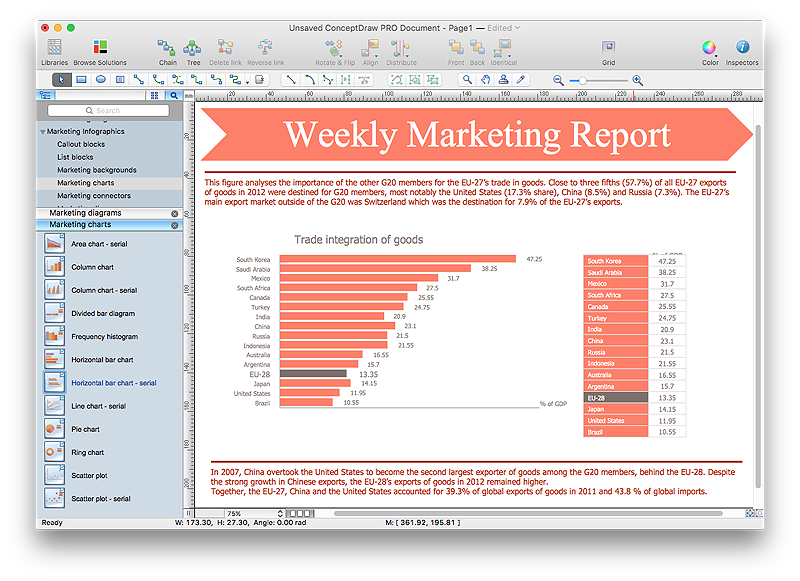
How to Start Diagramming on Mac Using ConceptDraw PRO
In this tutorial we will explain how to create a simple chart in ConceptDraw PRO using a template, and how to use the library objects.
HelpDesk
How to Create the Custom Diagram Template on Mac
ConceptDraw PRO enables you to place your own templates. You can create diagram with ConceptDraw PRO using your custom Template. You can set up your Template as a default ConceptDraw PRO start page. A template diagram is a drawing that serves as a starting point for a new graphic document. When you open a template, it is pre-formatted in some way. For example, you might use template that is formatted as an organizational chart. The template would likely have a workspace and a corresponding object libraries. When you save a file created with a template, you are usually prompted to save a copy of the file, so that you don't save over the template. Templates can either come with a proper solution or can be created by the user. If you find yourself creating similar documents over and over again, it might be a good idea to save one of them as a template. Then you won't have to format your documents each time you want to make a new one. Just open the template and start from there.Post and Mail - Design Elements
Deliver your message with ConceptDraw Post Mail Design Elements. Samples, templates and libraries contain vector clip art for drawing the Post and Mail Illustrations. Choose your graphic Mail illustration among Envelope, Postal wrapper, Air-envelopes, Parcel, Mail box, Postman, Courier, E-mail.HelpDesk
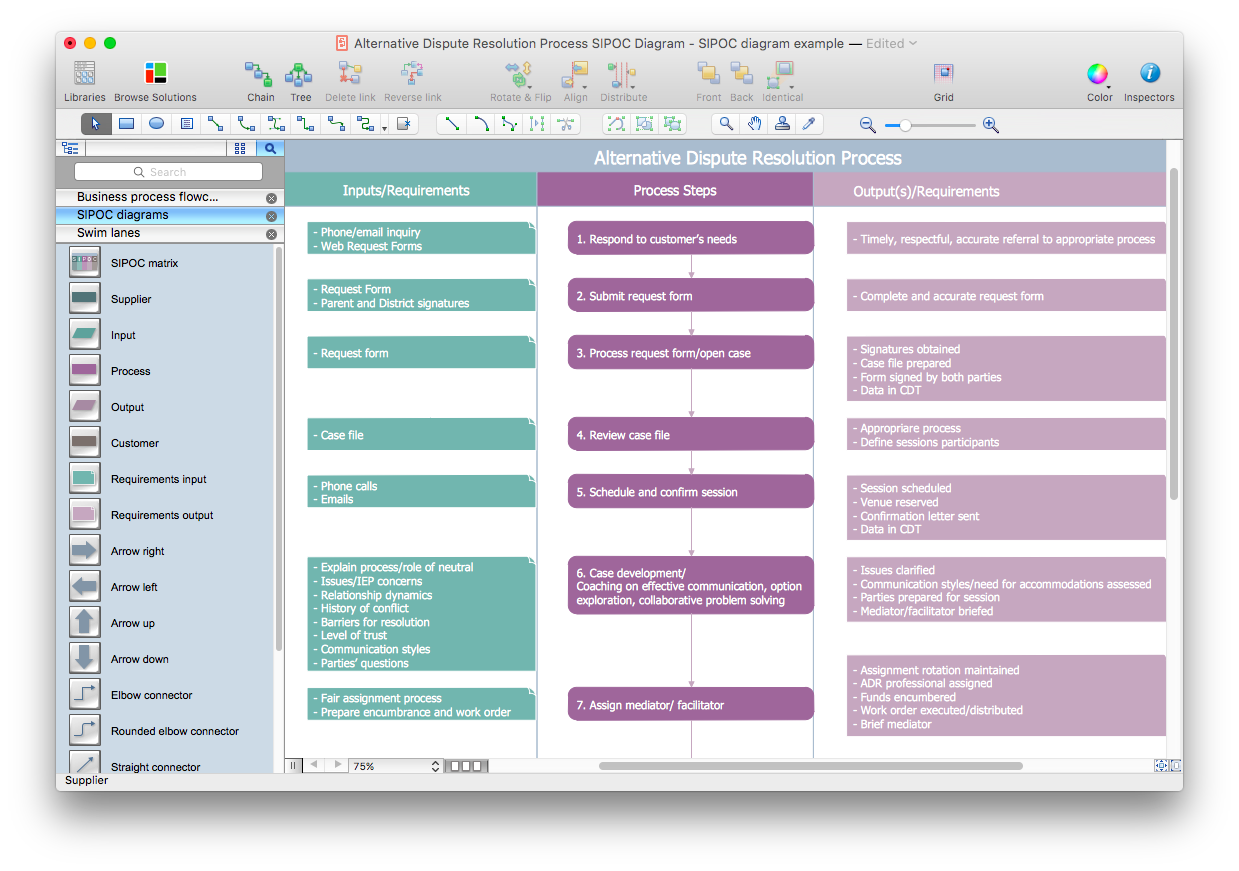
How to Create a SIPOC Diagram Using ConceptDraw PRO
SIPOC (suppliers, inputs, process, outputs, customers) diagram is focused on the quality of a business process inputs and outputs. SIPOC diagram has a form of a segmented table that gives comprehensive outline for each category. SIPOC diagram depicts the start and end of a process, and the relationships between a company and its suppliers. SIPOC diagram is an important part of the Six Sigma methodology. With its Business Process Mapping solution, ConceptDraw PRO offers a power set of process mapping tools to empower quality management within an organization.HelpDesk
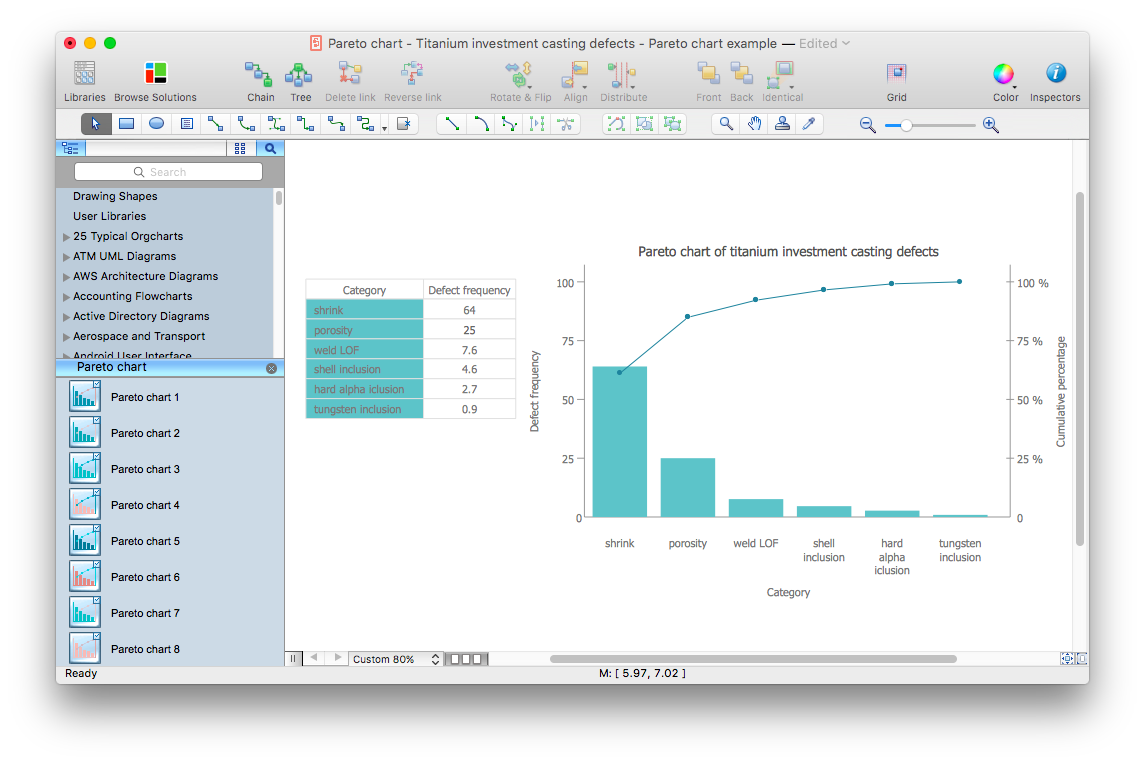
How to Draw a Pareto Chart Using ConceptDraw PRO
The Seven Basic Tools of Quality were picked as effective visual tool-set for identifying the root cause of quality-related problems within the workplace. Seven Basic Tools of Quality comprise of seven diagram that are diverse enough to be used to any business troubleshooting scenario, but simple enough that employees of all types can understand and apply them. One of these tools is a Pareto chart. It combines both a line graph and a bar chart, where the bar chart displays data values, and a line represents a total value. Pareto chart is used for quality control to identify the source of the quality problem. ConceptDraw Seven Basic Tools of Quality solution delivers a big set of vector stencil libraries and samples for each quality control diagram, including a Pareto chart.HelpDesk
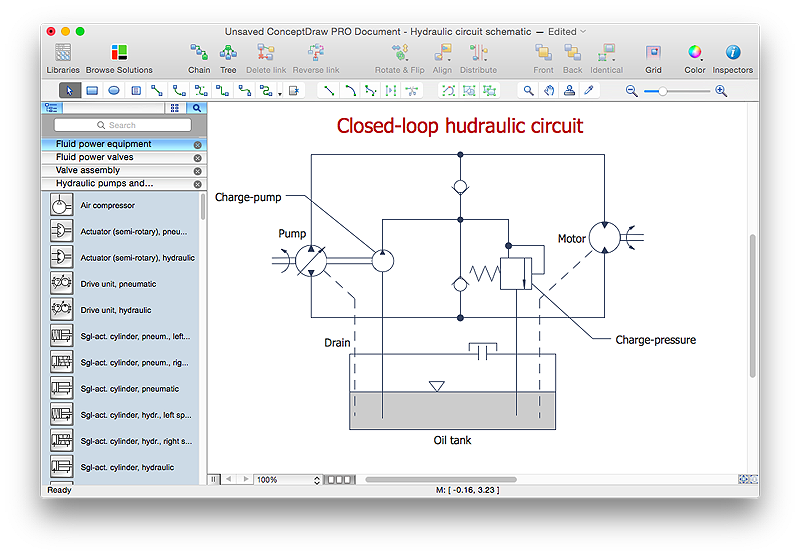
How to Create a Mechanical Diagram
Mechanical Engineering drawing is a type of technical drawing that helps analyze complex engineering systems. Mechanical Engineering diagrams are often a set of detailed drawings used for engineering or construction projects. Making Mechanical Engineering diagram involves many different elements that can be managed using ConceptDraw PRO. You can design elements for drawing parts, assembly, pneumatic, and hydraulic systems for mechanical engineering. With ConceptDraw PRO you can easily create and communicate the Mechanical Engineering diagram of any complexity.HelpDesk
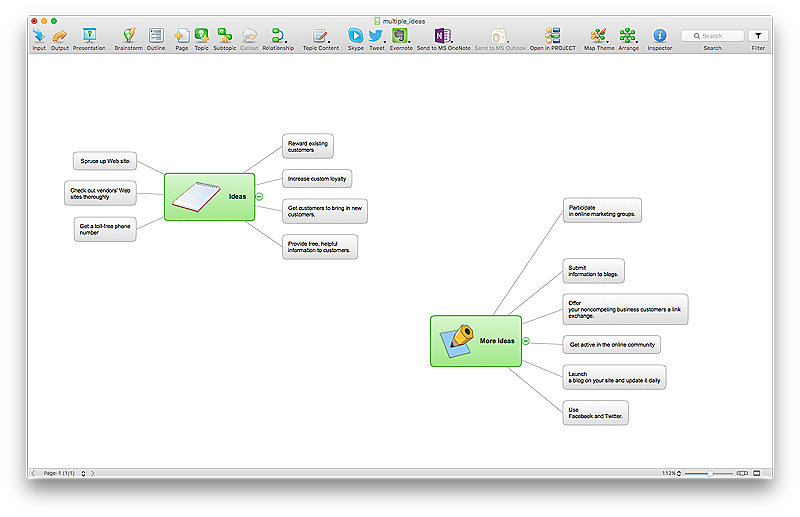
How to Create a Mind Map with Multiple Main Ideas
Classical mind map consists from the single Main Idea surrounded with related ideas and branches, deepening the main theme. The Multiple Main Idea on a single mind map page is a really useful when you have a lot of corresponding ideas. ConceptDraw MINDMAP allows you to insert a number of different mind maps onto a single workspace.
- Scrum sprint cycle | Scrum | Scrum workspace | Scrum Infographic
- Scrum workspace | Agile Methodology | Scrum Workflow | Agile ...
- Scrum sprint cycle | Scrum workspace | Scrum board suggesting to ...
- Person Infographic Icon
- Scrum workspace | Design elements - Scrum workspace | Scrum ...
- Scrum process work items and workflow | Scrum workspace | Scrum ...
- Scrum workspace | Design elements - Scrum artifacts | Sprint ...
- Agile Scrum Sprint
- Infographics Backlog
- Scrum board suggesting to use Kanban | Kanban Board Software ...
- Agile Scrum Role Infographics
- Scrum Master Infographics
- Scrum | Scrum Workflow | Scrum sprint cycle | Infographic Projects ...
- SSADM Diagram | Design elements - Scrum people | Scrum ...
- Design elements - Scrum people
- Scrum Based Development Infographic
- Icon Scrum Team Members
- Design elements - Scrum workspace | Office - Design Elements ...
- Scrum workflow | Design elements - Scrum workspace | Design ...
- Agile Process Scrum Infographic
