SSADM Diagram

The vector stencils library "Scrum people" contains 30 icons: scrum master, product owner, development team, etc.
Use this clipart set to design your agile software development diagrams and infographics with ConceptDraw PRO software.
"There are three core roles in the scrum framework. These core roles are those committed to the project in the scrum process — they are the ones producing the product (objective of the project). They represent the scrum team. ...
Product owner
The product owner represents the stakeholders and is the voice of the customer, who is accountable for ensuring that the team delivers value to the business. The product owner writes (or has the team write) customer-centric items (typically user stories), ranks and prioritizes them, and adds them to the product backlog. ...
Development team
The development team is responsible for delivering potentially shippable increments (PSIs) of product at the end of each sprint (the sprint goal). A team is made up of 3–9 individuals who do the actual work (analyse, design, develop, test, technical communication, document, etc.). Development teams are cross-functional, with all of the skills as a team necessary to create a product increment. The development team in scrum is self-organizing...
Scrum master
Scrum is facilitated by a scrum master, who is accountable for removing impediments to the ability of the team to deliver the product goals and deliverables. The scrum master is not a traditional team lead or project manager, but acts as a buffer between the team and any distracting influences. The scrum master ensures that the scrum process is used as intended. The scrum master helps ensure the team follows the agreed scrum processes, often facilitates key sessions, and encourages the team to improve." [Scrum (software development). Wikipedia]
The clip art sample "Design elements - Scrum people" is included in the Scrum solution from the Project Management area of ConceptDraw Solution Park.
Icon set
Used Solutions
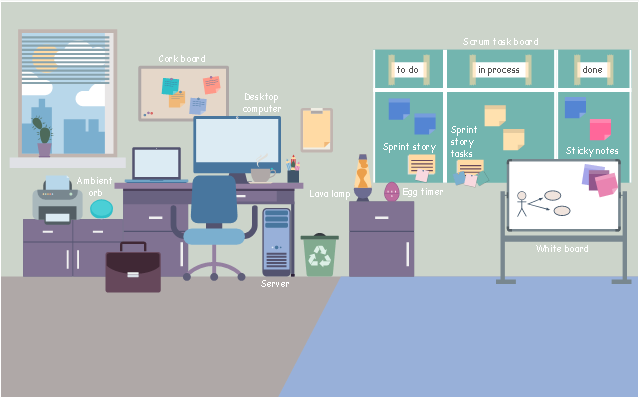
This agile software development infographic example was inspired by Mike Cohn's post "The Ideal Agile Workspace" from the Mountain Goat Software blog.
"... a list of all the things that ... should be visible within the ideal agile workspace:
* Big Visible Charts. ... the sprint burndown chart, showing the number of hours remaining as of each day of the current sprint. ... big visible charts showing the number of passing customer acceptance tests, the pass/ fail status of tests by day, sprint and release burndown charts, number of new stories introduced to the product backlog per sprint ...
* Additional feedback devices. ... a lava lamp that is turned on whenever the automated build is broken. ... flashing red traffic lights to indicate exceptional conditions such as an issue on a production server. ... ambient orbs and Nabaztag rabbits, which are wireless programmable devices that can also be configured to change colors, speak messages, or wiggle their ears as a team desires.
* Everyone on your team. Each person on the team should ideally be able to see each other person on the team. ...
* The sprint backlog. ... The best way to do that is by displaying the sprint backlog on a wall, ideally in the form of a task board A task board is usually oriented in rows and columns with each row containing a particular user story and one index card or sticky note for each task involved in that story. Task cards are organized in columns, minimally including “To Do” “In Process,” and “Done.” ...
* The product backlog. ... tack the index cards with those upcoming user stories on a wall where all can see them. ...
* At least one big white board. ...
* Someplace quiet and private. ...
* Food and drink. ...
* A window." [mountaingoatsoftware.com/ blog/ the-ideal-agile-workspace].
The infographic sample "Scrum workspace" was created using the ConceptDraw PRO software extended with the Scrum solution from the Project Management area of ConceptDraw Solution Park.
Infographic
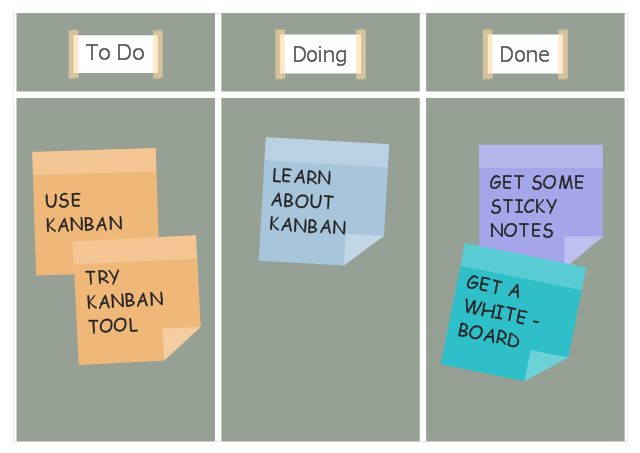
This agile software development infographic example was designed on the base of the Wikimedia Commons file: Simple-kanban-board-.jpg. [commons.wikimedia.org/ wiki/ File:Simple-kanban-board-.jpg]
This file is licensed under the Creative Commons Attribution-Share Alike 3.0 Unported license. [creativecommons.org/ licenses/ by-sa/ 3.0/ deed.en]
"The basic Scrumban board is composed out of three columns: To Do, Doing and Done. After the planning meeting the tasks are added to the To Do column, when a team member is ready to work on a task, he/ she moves it to the Doing column and when he/ she completes it, he/ she moves it to the Done column. The Scrumban board visually represents the progress of the team. The task board columns are adapted and expanded based on the team's work progress. The most common add-ons include priority columns in the To Do section and columns like Design, Manufacturing, Testing in the Doing section." [Scrumban. Wikipedia]
The infographic sample "Scrum board suggesting to use Kanban" was created using the ConceptDraw PRO software extended with the Scrum solution from the Project Management area of ConceptDraw Solution Park.
Infographic
The vector stencils library "Scrum workspace" contains 21 icons.
Use this clipart set to design your agile software development diagrams and infographics with ConceptDraw PRO software.
"... a list of all the things that ... should be visible within the ideal agile workspace:
Big Visible Charts. ... the sprint burndown chart, showing the number of hours remaining as of each day of the current sprint. ... big visible charts showing the number of passing customer acceptance tests, the pass/ fail status of tests by day, sprint and release burndown charts, number of new stories introduced to the product backlog per sprint, and more.
Additional feedback devices. In addition to big, visible charts, it is common for an agile team to use additional visual feedback devices in their workspace. One of the most common is a lava lamp that is turned on whenever the automated build is broken.
... flashing red traffic lights to indicate exceptional conditions such as an issue on a production server. Also popular are ambient orbs and Nabaztag rabbits, which are wireless programmable devices that can also be configured to change colors, speak messages, or wiggle their ears as a team desires. ...
Everyone on your team. Each person on the team should ideally be able to see each other person on the team. This absolutely includes the ScrumMaster and ideally includes the product owner. ...
The sprint backlog. One of the best ways to ensure that everything necessary is completed in the sprint is to make the sprint backlog visible. The best way to do that is by displaying the sprint backlog on a wall, ideally in the form of a task board ...
The product backlog. One problem with running an endless series of sprints is that each can feel disconnected or isolated from the whole of a planned released or related set of new capabilities. A good way to reduce the impact of this problem is by displaying the product backlog somewhere clearly visible. ... tack the index cards with those upcoming user stories on a wall where all can see them. This allows team members to see how the user stories they are working on in the current sprint relate to others that are coming soon.
At least one big white board. ... Locating this in the team’s common workspace encourages spontaneous meetings." [mountaingoatsoftware.com/ blog/ the-ideal-agile-workspace]
The clip art sample "Design elements - Scrum workspace" is included in the Scrum solution from the Project Management area of ConceptDraw Solution Park.
Icon set
The vector stencils library "Scrum workflow" contains 39 icons.
Use this clipart set to design your agile software development diagrams and flowcharts with ConceptDraw PRO software.
"A sprint (or iteration) is the basic unit of development in scrum. The sprint is a timeboxed effort; that is, it is restricted to a specific duration. The duration is fixed in advance for each sprint and is normally between one week and one month, with two weeks being the most common.
Each sprint starts with a sprint planning event that aims to define a sprint backlog, identify the work for the sprint, and make an estimated commitment for the sprint goal. Each sprint ends with a sprint review and sprint retrospective, that reviews progress to show to stakeholders and identify lessons and improvements for the next sprints.
Scrum emphasizes working product at the end of the sprint that is really done. In the case of software, this likely includes that the software has been integrated, fully tested, end-user documented, and is potentially shippable." [Scrum (software development). Wikipedia]
The clip art sample "Design elements - Scrum workflow" is included in the Scrum solution from the Project Management area of ConceptDraw Solution Park.
Icon set
Used Solutions
 Mechanical Engineering
This solution extends ConceptDraw PRO v.9 mechanical drawing software (or later) with samples of mechanical drawing symbols, templates and libraries of design elements, for help when drafting mechanical engineering drawings, or parts, assembly, pneumatic,
 Entity-Relationship Diagram (ERD)
Entity-Relationship Diagram (ERD) solution extends ConceptDraw PRO software with templates, samples and libraries of vector stencils from drawing the ER-diagrams by Chen's and crow’s foot notations.
 Line Graphs
How to draw a Line Graph with ease? The Line Graphs solution extends the capabilities of ConceptDraw PRO v10 with professionally designed templates, samples, and a library of vector stencils for drawing perfect Line Graphs.
 Area Charts
Area Charts are used to display the cumulative totals over time using numbers or percentages; or to show trends over time among related attributes. The Area Chart is effective when comparing two or more quantities. Each series of data is typically represented with a different color, the use of color transparency in an object’s transparency shows overlapped areas and smaller areas hidden behind larger areas.
- Testing In Scrum Methodology
- Agile Methodology | SSADM Diagram | Scrum Workflow | Agile ...
- SSADM Diagram | Mechanical Engineering | What Is Scrum In Testing
- What Is Agile Testing Scrum And Sprint
- Scrum Agile Testing
- Workflow Testing
- Agile Methodology | How to Create an IDEF0 Diagram for an ...
- Scrum workflow | Scrum | Scrum board | Scrum Free Software
- Scrum workflow | Scrum board | Scrum process work items and ...
- Agile Methodology | SSADM Diagram | Scrum process work items ...
- Agile Scrum Sprint
- Cross-Functional Flowcharts | eLearning for Skype | Scrum Test
- Create Project Vision | Scrum | Scrum board | Agile Software ...
- Basic Flowchart Symbols and Meaning | Agile Methodology | Scrum ...
- Scrum workflow | Scrum board | Scrum | Scrum Software Free
- Scrum sprint cycle | Scrum board suggesting to use Kanban | Scrum ...
- Agile Methodology | Scrum process work items and workflow | PM ...
- Agile Methodology | Scrum board | Scrum | Agile Development ...
- Scrum | Scrum Workflow | Scrum workflow | Project Management ...