HelpDesk
How to Change the Working Time in a Project

Process Flowchart


HelpDesk
How to Operate with Project Time Frames in ConceptDraw PROJECT

Examples of Flowcharts, Org Charts and More


Gant Chart in Project Management


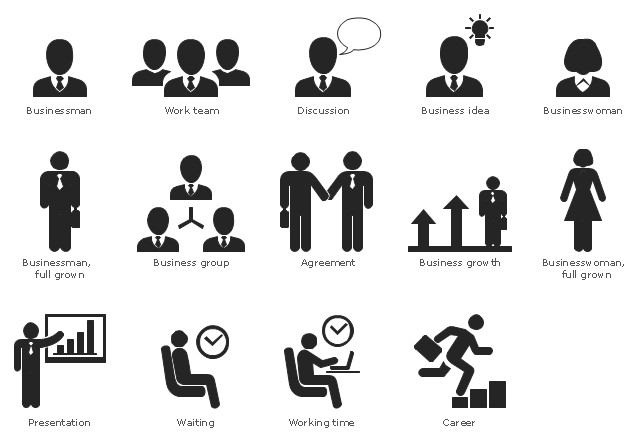
The vector stencils library "Business people pictograms" contains 14 icons of business people.
Use it to draw your pictorial infographics.
The example "Business people pictograms - Vector stencils library" was created using the ConceptDraw PRO diagramming and vector drawing software extended with the Pictorial infographics solution from the area "What is infographics" in ConceptDraw Solution Park.
Businessman

Businesswoman

Businessman, full grown

Businesswoman, full grown

Business group

Work team

Presentation

Waiting

Working time

Discussion

Business idea

Agreement

Career

Business growth

HelpDesk
How to Use the Effort-Driven Scheduling Method

HelpDesk
What Information to be Displayed in the ConceptDraw PROJECT Gantt Chart View


HelpDesk
How are Summary Values of Project Phases Calculated

Value stream with ConceptDraw PRO

The vector stencils library "Business people pictograms" contains 14 icons of business people.
Use it to draw your pictorial infographics.
The example "Business people pictograms - Vector stencils library" was created using the ConceptDraw PRO diagramming and vector drawing software extended with the Pictorial infographics solution from the area "What is infographics" in ConceptDraw Solution Park.
Use it to draw your pictorial infographics.
The example "Business people pictograms - Vector stencils library" was created using the ConceptDraw PRO diagramming and vector drawing software extended with the Pictorial infographics solution from the area "What is infographics" in ConceptDraw Solution Park.
Businessman
Businesswoman
Businessman, full grown
Businesswoman, full grown
Business group
Work team
Presentation
Waiting
Working time
Discussion
Business idea
Agreement
Career
Business growth
Basic Flowchart Symbols and Meaning


HelpDesk
How to Create a Business Process Workflow Diagram Using ConceptDraw PRO

The vector stencils library "Business people pictograms" contains 14 business people pictograms.
Use it to draw your infographics.
The example "Design elements - Business people pictograms" was created using the ConceptDraw PRO diagramming and vector drawing software extended with the Pictorial Infographic solution from the area "What is infographics" in ConceptDraw Solution Park.
Use it to draw your infographics.
The example "Design elements - Business people pictograms" was created using the ConceptDraw PRO diagramming and vector drawing software extended with the Pictorial Infographic solution from the area "What is infographics" in ConceptDraw Solution Park.
Pictograms
- Working Waiting Time Png Icon
- Time Png
- Time Vector Png
- Working Png
- Time - Vector stencils library | Road signs - Vector stencils library ...
- Work Vector Png
- Discussion People Png
- Export from ConceptDraw PRO Document to a Graphic File | Time ...
- Business Vector Png
- Career Pictogram Png
- Working Vector Png
- Business Growth Icon Png
- Business People Vector Png
- Office Layout | Cubicles and work surfaces - Vector stencils library ...
- People Work Png
- Career Vector Png
- Png Time
- Png Image For Earthquake
- Cubicle layout | Cubicles and work surfaces - Vector stencils library ...
- People Elements Png