Basic Diagramming


Pie Chart Software

Line Graph

This picture graph sample shows how does manufacturing compare with other industries in U.S. It was designed using data from the U.S. Census Bureau website. [census.gov/ how/ img/ manufacturing_ 2014_ th.jpg]
"Manufacturing is the production of merchandise for use or sale using labour and machines, tools, chemical and biological processing, or formulation. The term may refer to a range of human activity, from handicraft to high tech, but is most commonly applied to industrial production, in which raw materials are transformed into finished goods on a large scale. Such finished goods may be used for manufacturing other, more complex products, such as aircraft, household appliances or automobiles, or sold to wholesalers, who in turn sell them to retailers, who then sell them to end users and consumers." [Manufacturing. Wikipedia]
The arrows bar chart example "Manufacturing in America" was created using the ConceptDraw PRO diagramming and vector drawing software extended with the Picture Graphs solution from the Graphs and Charts area of ConceptDraw Solution Park.
Arrows bar chart

Percentage Pie Chart. Pie Chart Examples

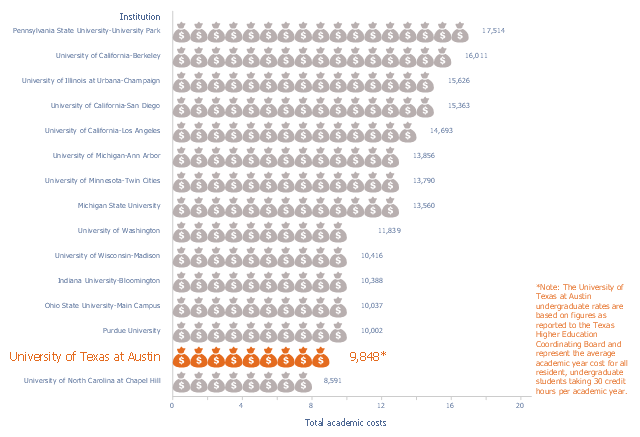
This picture bar graph sample shows the UT Austin Tuition Ranks 6th Compared to Other Texas Public Universities (Tuition and fees per semester, fall 2015). It was designed using data of the diagram "Compare UT Tuition" from the website of the University of Texas at Austin.
[tuition.utexas.edu/ compare]
The pictorial chart "Academic costs for residents, 2015-16" was created using the ConceptDraw PRO diagramming and vector drawing software extended with the Picture Graphs solution from the Graphs and Charts area of ConceptDraw Solution Park.
[tuition.utexas.edu/ compare]
The pictorial chart "Academic costs for residents, 2015-16" was created using the ConceptDraw PRO diagramming and vector drawing software extended with the Picture Graphs solution from the Graphs and Charts area of ConceptDraw Solution Park.
Pictorial chart


Line Chart Examples

Process Flowchart


Column Chart Software

Pyramid Diagram

Marketing Charts

Donut Chart Templates


Histogram

- Picture Graphs | How to Create a Picture Graph in ConceptDraw ...
- Picture Graphs
- Example A Picture Graph
- Pictures of Graphs | Picture Graphs | How to Create a Picture Graph ...
- Picture Graphs | Picture Graph | What Is a Picture Graph ? | Example ...
- Picture Graphs | Design elements - Picture graphs | Picture Graph ...
- Barrie population - Picture bar graph | Picture graphs - Vector ...
- Process Flowchart | What Is a Picture Graph ? | What Is a Line Chart ...
- Picture Graphs | Sales Growth. Bar Graphs Example | Picture Graph ...
- Line Graphs | Bar Graphs | Line Graph Charting Software | Graph
- What Is a Picture Graph ? | Picture Graphs | How to Create a Picture ...
- Picture Graphs | Sales Growth. Bar Graphs Example | Barrie ...
- Pictures Of Graph Solutiins
- Barrie population - Picture bar graph | Design elements - Picture ...
- How To Draw Pictures And Graphs Using A Computer
- How to Draw a Pictorial Chart in ConceptDraw PRO | How to Draw ...
- How to Create a Picture Graph in ConceptDraw PRO | Flowchart ...
- Line Graph | Design elements - Line graphs | How to Draw a Line ...
- Picture graphs - Vector stencils library | Total value of manufacturers ...
- Basic Diagramming | Line Chart Examples | Picture Graph ...