Example Process Flow

 Event-driven Process Chain Diagrams
Event-driven Process Chain (EPC) Diagram is a type of flowchart widely used for modeling in business engineering and reengineering, business process improvement, and analysis. EPC method was developed within the Architecture of Integrated Information Systems (ARIS) framework.
 Flowcharts
The Flowcharts solution for ConceptDraw PRO is a comprehensive set of examples and samples in several varied color themes for professionals that need to represent graphically a process. Solution value is added by the basic flow chart template and shapes' libraries of flowchart notation. ConceptDraw PRO flow chart creator lets one depict the processes of any complexity and length, as well as design the Flowchart either vertically or horizontally.
How To Create a FlowChart using ConceptDraw

 Accounting Flowcharts
Accounting Flowcharts solution extends ConceptDraw PRO software with templates, samples and library of vector stencils for drawing the accounting flow charts.
Best Program to Create a Fowchart

Flowchart Software


 ConceptDraw Solution Park
ConceptDraw Solution Park collects graphic extensions, examples and learning materials
Basic Flowchart Symbols and Meaning

Beauty of Event-driven Process Chain (EPC) diagrams
")
 Composition Dashboard
Composition dashboard solution extends ConceptDraw PRO software with templates, samples and vector stencils library with charts and indicators for drawing visual dashboards showing data composition.
Flowchart

Example of DFD for Online Store (Data Flow Diagram) DFD Example


This TQM diagram sample was redesigned from the illustration of "Inland acid sulfate soil and water quality fact sheet" from website of the Department of the Environment of the Australian Government.
[environment.gov.au/ resource/ inland-acid-sulfate-soil-and-water-quality-fact-sheet]
"Adaptive management (AM), also known as adaptive resource management (ARM), is a structured, iterative process of robust decision making in the face of uncertainty, with an aim to reducing uncertainty over time via system monitoring. In this way, decision making simultaneously meets one or more resource management objectives and, either passively or actively, accrues information needed to improve future management. Adaptive management is a tool which should be used not only to change a system, but also to learn about the system (Holling 1978). Because adaptive management is based on a learning process, it improves long-run management outcomes. The challenge in using the adaptive management approach lies in finding the correct balance between gaining knowledge to improve management in the future and achieving the best short-term outcome based on current knowledge (Allan & Stankey 2009)." [Adaptive management. Wikipedia]
The TQM flowchart example "Acid sulfate soil adaptive management framework" was created using the ConceptDraw PRO diagramming and vector drawing software extended with the Total Quality Management (TQM) Diagrams solution from the Quality area of ConceptDraw Solution Park.
TQM diagram
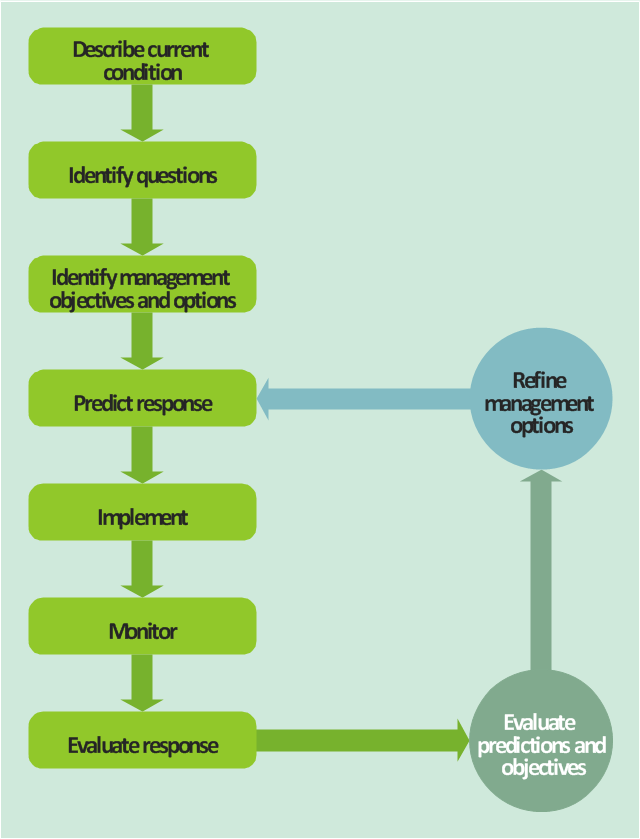
 Illustration Area
Solutions from the Illustrations Area of ConceptDraw Solution Park collect templates, samples and libraries of color scalable vector stencils, icons and clip art for illustrating documents, presentations, infographics, web sites and blogs.
- Example Process Flow | Best Program to Create a Fowchart ...
- Data flow model diagram template | Data Flow Diagrams | Data Flow
- Example Process Flow | How To Create a FlowChart using ...
- Structured Systems Analysis and Design Method (SSADM) with ...
- Example Process Flow | Example of Flowchart Diagram | Flow Chart ...
- Flow chart Example . Warehouse Flowchart | Flow process chart ...
- Example Process Flow | Flow Chart Diagram Examples | Accounting ...
- Data flow diagram template
- Example Process Flow | UML 2 4 Process Flow Diagram | Flowchart ...
- UML Class Diagram Example - Social Networking Site | AWS ...
- Example Process Flow | Cross-Functional Flowcharts | Flow Chart ...
- Example Process Flow | Accounting Flowcharts | Best Program to ...
- Example Process Flow | Flow Chart Diagram Examples | Process ...
- Example Process Flow
- Seven Management and Planning Tools | Types of Flowchart ...
- Accounting Flowcharts | Example Process Flow | How To Create a ...
- Example Process Flow | Flow Chart Diagram Examples | Event ...
- Business Flowchart Generation with ConceptDraw PRO | Cross ...
- Software and Database Design with ConceptDraw PRO | Process ...
- Business Process Reengineering Examples