This work flow chart sample was redesigned from the picture "Weather Forecast" from the article "Simulation Workflows".
[iaas.uni-stuttgart.de/ forschung/ projects/ simtech/ sim-workflows.php]
"(1) The weather is predicted for a particular geological area. Hence, the workflow is fed with a model of the geophysical environment of ground, air and water for a requested area.
(2) Over a specified period of time (e.g. 6 hours) several different variables are measured and observed. Ground stations, ships, airplanes, weather balloons, satellites and buoys measure the air pressure, air/ water temperature, wind velocity, air humidity, vertical temperature profiles, cloud velocity, rain fall, and more.
(3) This data needs to be collected from the different sources and stored for later access.
(4) The collected data is analyzed and transformed into a common format (e.g. Fahrenheit to Celsius scale). The normalized values are used to create the current state of the atmosphere.
(5) Then, a numerical weather forecast is made based on mathematical-physical models (e.g. GFS - Global Forecast System, UKMO - United Kingdom MOdel, GME - global model of Deutscher Wetterdienst). The environmental area needs to be discretized beforehand using grid cells. The physical parameters measured in Step 2 are exposed in 3D space as timely function. This leads to a system of partial differential equations reflecting the physical relations that is solved numerically.
(6) The results of the numerical models are complemented with a statistical interpretation (e.g. with MOS - Model-Output-Statistics). That means the forecast result of the numerical models is compared to statistical weather data. Known forecast failures are corrected.
(7) The numerical post-processing is done with DMO (Direct Model Output): the numerical results are interpolated for specific geological locations.
(8) Additionally, a statistical post-processing step removes failures of measuring devices (e.g. using KALMAN filters).
(9) The statistical interpretation and the numerical results are then observed and interpreted by meteorologists based on their subjective experiences.
(10) Finally, the weather forecast is visualized and presented to interested people." [iaas.uni-stuttgart.de/ forschung/ projects/ simtech/ sim-workflows.php]
The example "Workflow diagram - Weather forecast" was drawn using the ConceptDraw PRO diagramming and vector drawing software extended with the Workflow Diagrams solution from the Business Processes area of ConceptDraw Solution Park.
Work flow chart

How can you illustrate the weather condition

Work Flow Chart

Business People Figures

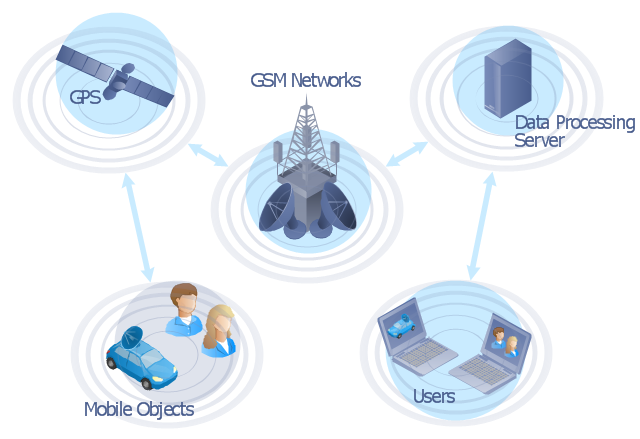
"The Global Positioning System (GPS) is a space-based satellite navigation system that provides location and time information in all weather conditions, anywhere on or near the Earth where there is an unobstructed line of sight to four or more GPS satellites. The system provides critical capabilities to military, civil and commercial users around the world. It is maintained by the United States government and is freely accessible to anyone with a GPS receiver." [Global Positioning System. Wikipedia]
This GPS operation diagram example was created using the ConceptDraw PRO diagramming and vector drawing software extended with the Telecommunication Network Diagrams solution from the Computer and Networks area of ConceptDraw Solution Park.
This GPS operation diagram example was created using the ConceptDraw PRO diagramming and vector drawing software extended with the Telecommunication Network Diagrams solution from the Computer and Networks area of ConceptDraw Solution Park.
GPS network diagram
Aerospace - Design Elements

Beauty in nature Illustrations and Clipart

Nature Drawings - How to Draw

This interactive voice response (IVR) diagram sample illustrates the IVR services.
"IVR systems are typically intended to service high call volumes, reduce cost and improve the customer experience. Examples of typical IVR applications are telephone banking, televoting, and credit card services. ...
Voice-Activated Dialing
... (VAD) IVR systems are used to automate routine enquiries to switchboard or PABX (Private Automatic Branch eXchange) operators, and are used in many hospitals and large businesses to reduce the caller waiting time. ...
Entertainment and information.
Some of the largest installed IVR platforms are used for televoting on television game shows, ... which can generate enormous call spikes. Often, the network provider will have to deploy call gapping in the PSTN to prevent network overload. ...
Anonymous access.
IVR systems allow callers to obtain data relatively anonymously. Hospitals and clinics have used IVR systems to allow callers to receive anonymous access to test results. ...
Clinical trials.
IVR systems are used by pharmaceutical companies and contract research organizations to conduct clinical trials and manage the large volumes of data generated. ... Applications include patient randomization and drug supply management. ...
Outbound calling.
IVR systems can be used for outbound calls, as IVR systems are more intelligent than many predictive dialer systems, and can use Call Progress Detection to recognize different line conditions...
Other common IVR services include:
Mobile - Pay-As-You-Go account funding; registration; mobile purchases, such as ring tones and logos;
Banking - balance, payments, transfers, transaction history;
Retail & Entertainment - orders, bookings, credit & debit card payments;
Utilities - meter readings; account look-up, history and balance, payment, consumption history;
Travel — ticket booking, flight information, check-in;
Weather forecasts, water, road and ice conditions" [Interactive voice response. Wikipedia]
The IVR diagram example "IVR services" was created using the ConceptDraw PRO diagramming and vector drawing software extended with the Interactive Voice Response Diagrams solution from the Computer and Networks area of ConceptDraw Solution Park.
IVR diagram

The vector stencils library "Weather" contains 17 weather clipart images for drawing illustrations on climate to show cloudiness, air temperature, precipitation, wind.
"Weather is the state of the atmosphere, to the degree that it is hot or cold, wet or dry, calm or stormy, clear or cloudy. Most weather phenomena occur in the troposphere, just below the stratosphere. Weather generally refers to day-to-day temperature and precipitation activity, whereas climate is the term for the average atmospheric conditions over longer periods of time. When used without qualification, "weather", is generally understood to mean the weather of Earth.
Weather is driven by air pressure (temperature and moisture) differences between one place and another. These pressure and temperature differences can occur due to the sun angle at any particular spot, which varies by latitude from the tropics. The strong temperature contrast between polar and tropical air gives rise to the jet stream. Weather systems in the mid-latitudes, such as extratropical cyclones, are caused by instabilities of the jet stream flow. Because the Earth's axis is tilted relative to its orbital plane, sunlight is incident at different angles at different times of the year. On Earth's surface, temperatures usually range ±40°C (−40°F to 100°F) annually. Over thousands of years, changes in Earth's orbit affect the amount and distribution of solar energy received by the Earth and influence long-term climate and global climate change." [Weather. Wikipedia]
The clip art example "Weather - Vector stencils library" was created using the ConceptDraw PRO diagramming and vector drawing software extended with the Nature solution from the Illustration area of ConceptDraw Solution Park.
www.conceptdraw.com/ solution-park/ illustrations-nature
Sunny

Cloudy

Overcast

Snow

Rain

Lightning

Hot

Warm

Frost

Mist

Strong wind

Flood

Tsunami

Dew

Hoar-frost

Earthquake

Snowflake

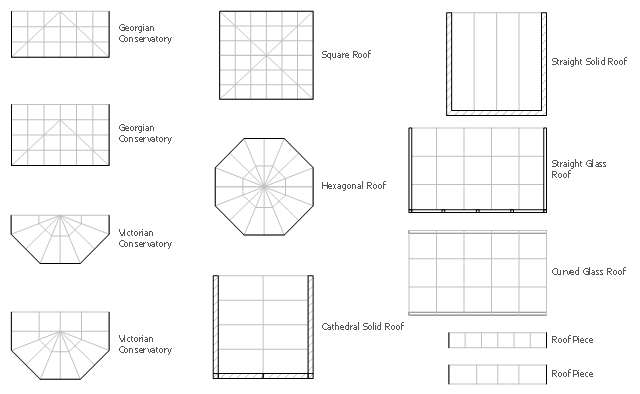
The design elements library Sunrooms contains 12 symbols of glass roof and conservatory.
Use the vector stencils library Sunrooms to draw the sunroom design plans, home layouts, architectural and construction documents.
"A sunroom, sun parlor, sun porch, or sun lounge is a structure usually constructed onto the side of a house which allows enjoyment of the surrounding landscape while being sheltered from adverse weather conditions such as rain and wind. It can be referred to as a patio room, solarium, conservatory or Florida room. The concept is popular in the United States, Europe, Canada, Australia, and New Zealand.
In Great Britain, the term conservatory is usually used to refer to a sunroom despite not being used as a greenhouse as traditional conservatories were. However, sunrooms with opaque roofs may be considered distinct from conservatories with transparent or semi-transparent roofs." [Sunroom. Wikipedia]
The shapes library Sunrooms is provided by the Floor Plans solution from the Building Plans area of ConceptDraw Solution Park.
Sunroom symbols
- How can you illustrate the weather condition | Workflow diagram ...
- Workflow diagram - Weather forecast | How can you illustrate the ...
- Diagrams Of Weather Symbols
- Workflow diagram - Weather forecast | Food security assessment ...
- Work Flow Chart | Workflow diagram - Weather forecast | Business ...
- Diagram Of Weather Elements
- Workflow diagram - Weather forecast | Work Flow Chart | Workflow ...
- How can you illustrate the weather condition | Nature Drawings ...
- Workflow diagram - Weather forecast | Data Flow Diagram Symbols ...
- Earthquake disaster assessment - Workflow diagram | Workflow ...
- How can you illustrate the weather condition | Workflow Diagrams ...
- How can you illustrate the weather condition | Drawing Illustration ...
- How can you illustrate the weather condition | How to Draw a ...
- Diagrams Illustrating Metabolism In Planning
- Weather - Vector stencils library | Design elements - Weather ...
- How can you illustrate the weather condition | Design elements ...
- Workflow Diagrams | IVR services | Types of Flowcharts | Weather ...
- How can you illustrate the weather condition | Nature Drawings ...
- How can you illustrate the weather condition | Business People ...