This work flow chart sample was redesigned from the picture "Weather Forecast" from the article "Simulation Workflows".
[iaas.uni-stuttgart.de/ forschung/ projects/ simtech/ sim-workflows.php]
"(1) The weather is predicted for a particular geological area. Hence, the workflow is fed with a model of the geophysical environment of ground, air and water for a requested area.
(2) Over a specified period of time (e.g. 6 hours) several different variables are measured and observed. Ground stations, ships, airplanes, weather balloons, satellites and buoys measure the air pressure, air/ water temperature, wind velocity, air humidity, vertical temperature profiles, cloud velocity, rain fall, and more.
(3) This data needs to be collected from the different sources and stored for later access.
(4) The collected data is analyzed and transformed into a common format (e.g. Fahrenheit to Celsius scale). The normalized values are used to create the current state of the atmosphere.
(5) Then, a numerical weather forecast is made based on mathematical-physical models (e.g. GFS - Global Forecast System, UKMO - United Kingdom MOdel, GME - global model of Deutscher Wetterdienst). The environmental area needs to be discretized beforehand using grid cells. The physical parameters measured in Step 2 are exposed in 3D space as timely function. This leads to a system of partial differential equations reflecting the physical relations that is solved numerically.
(6) The results of the numerical models are complemented with a statistical interpretation (e.g. with MOS - Model-Output-Statistics). That means the forecast result of the numerical models is compared to statistical weather data. Known forecast failures are corrected.
(7) The numerical post-processing is done with DMO (Direct Model Output): the numerical results are interpolated for specific geological locations.
(8) Additionally, a statistical post-processing step removes failures of measuring devices (e.g. using KALMAN filters).
(9) The statistical interpretation and the numerical results are then observed and interpreted by meteorologists based on their subjective experiences.
(10) Finally, the weather forecast is visualized and presented to interested people." [iaas.uni-stuttgart.de/ forschung/ projects/ simtech/ sim-workflows.php]
The example "Workflow diagram - Weather forecast" was drawn using the ConceptDraw PRO diagramming and vector drawing software extended with the Workflow Diagrams solution from the Business Processes area of ConceptDraw Solution Park.
Work flow chart

Beauty in nature Illustrations and Clipart

Drawing Illustration

How can you illustrate the weather condition

HelpDesk
How to Create a Network Security Diagram Using ConceptDraw PRO

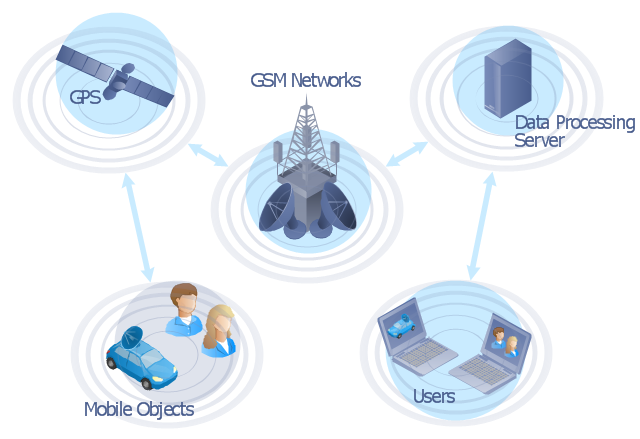
"The Global Positioning System (GPS) is a space-based satellite navigation system that provides location and time information in all weather conditions, anywhere on or near the Earth where there is an unobstructed line of sight to four or more GPS satellites. The system provides critical capabilities to military, civil and commercial users around the world. It is maintained by the United States government and is freely accessible to anyone with a GPS receiver." [Global Positioning System. Wikipedia]
This GPS operation diagram example was created using the ConceptDraw PRO diagramming and vector drawing software extended with the Telecommunication Network Diagrams solution from the Computer and Networks area of ConceptDraw Solution Park.
This GPS operation diagram example was created using the ConceptDraw PRO diagramming and vector drawing software extended with the Telecommunication Network Diagrams solution from the Computer and Networks area of ConceptDraw Solution Park.
GPS network diagram
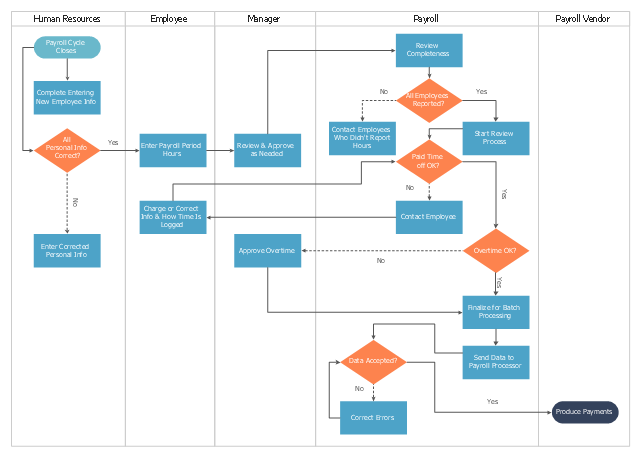
"Business process mapping refers to activities involved in defining what a business entity does, who is responsible, to what standard a business process should be completed, and how the success of a business process can be determined.
The main purpose behind business process mapping is to assist organizations in becoming more efficient. A clear and detailed business process map or diagram allows outside firms to come in and look at whether or not improvements can be made to the current process.
Business process mapping takes a specific objective and helps to measure and compare that objective alongside the entire organization's objectives to make sure that all processes are aligned with the company's values and capabilities.
ISO 9001 requires a business entity to follow a process approach when managing its business, and to this end creating business process maps will assist. The entity can then work towards ensuring its processes are effective (the right process is followed the first time), and efficient (continually improved to ensure processes use the smallest amount of resources)." [Business process mapping. Wikipedia]
The swim lane process map example "Payroll process" was drawn using the ConceptDraw PRO diagramming and vector drawing software extended with the Cross-Functional Flowcharts solution from the Business Processes area of ConceptDraw Solution Park.
Swim lane process mapping diagram
- Wether Clock Diagram
- Types of Flowcharts | Workflow diagram - Weather forecast | Work ...
- Workflow diagram - Weather forecast | Work Flow Chart | Workflow ...
- Workflow diagram - Weather forecast | Workflow Diagram Software ...
- How can you illustrate the weather condition | Workflow diagram ...
- Workflow diagram - Weather forecast | ConceptDraw Arrows10 ...
- Workflow diagram - Weather forecast | How can you illustrate the ...
- Workflow Diagram Software | Weather - Vector stencils library | Work ...
- Water cycle diagram | Weather - Vector stencils library | Weather ...
- Weather - Vector stencils library | Water cycle diagram | Weather ...
- Workflow diagram - Weather forecast | Work Flow Chart | Types of ...
- Workflow diagram - Weather forecast
- Earthquake disaster assessment - Workflow diagram | Weather ...
- Weather - Vector stencils library | Beauty in nature Illustrations and ...
- Diagrams Of Weather Symbols
- Rainfall Bar Chart | Water cycle diagram | Workflow diagram ...
- Simulation Flow Diagram
- Electrical Symbols — Power Sources | Workflow diagram - Weather ...
- Software Diagram Examples and Templates | Draw A Flow Chart To ...