This Water cycle diagram example was drawn using the ConceptDraw PRO diagramming and vector graphics software extended with the clipart libraries Geography and Weather.
"The water cycle, also known as the hydrologic cycle or the H2O cycle, describes the continuous movement of water on, above and below the surface of the Earth. The mass water on Earth remains fairly constant over time but the partitioning of the water into the major reservoirs of ice, fresh water, saline water and atmospheric water is variable depending on a wide range of climatic variables. The water moves from one reservoir to another, such as from river to ocean, or from the ocean to the atmosphere, by the physical processes of evaporation, condensation, precipitation, infiltration, runoff, and subsurface flow. In so doing, the water goes through different phases: liquid, solid (ice), and gas (vapor)." [Water cycle. Wikipedia]
This water cycle diagram example is included in the Nature solution from the Illustration area of ConceptDraw Solution Park.
Vector illustration

Drawing a Nature Scene

Drawing Illustration

Beauty in nature Illustrations and Clipart

 Nature
This solution extends ConceptDraw PRO software with samples, templates and libraries of vector clipart for drawing the Nature illustrations. Use it to make professional-looking documents, presentations and websites illustrated with color scalable vector c
"Ecosystems represent sources of natural capital and provide goods and services to society, also called ecosystem services. The Millennium Ecosystem Assessment identified over 24 ecosystem services that can be divided up into 4 general groups including: 1) provisioning, 2) supporting, 3) regulating and 4) cultural." [User:Sawtoothgirl/ Sustainable Real Estate Development. Wikipedia]
"Humankind benefits in a multitude of ways from ecosystems. Collectively, these benefits are known as ecosystem services. Ecosystem services are regularly involved in the provisioning of clean drinking water and the decomposition of wastes. While scientists and environmentalists have discussed ecosystem services implicitly for decades, these the ecosystem services concept itself was popularized by the Millennium Ecosystem Assessment (MA) in the early 2000s. This grouped ecosystem services into four broad categories: provisioning, such as the production of food and water; regulating, such as the control of climate and disease; supporting, such as nutrient cycles and crop pollination; and cultural, such as spiritual and recreational benefits. To help inform decision-makers, many ecosystem services are being assigned economic values." [Ecosystem services. Wikipedia]
The segmented pyramid diagram example "Ecosystem goods and services" was redesigned using the ConceptDraw PRO diagramming and vector drawing software from Wikimedia Commons file ES_ triangle.png.
[commons.wikimedia.org/ wiki/ File:ES_ triangle.png]
This file is licensed under the Creative Commons Attribution-Share Alike 3.0 Unported license. [creativecommons.org/ licenses/ by-sa/ 3.0/ deed.en]
This segmented pyramid diagram example "Ecosystem goods and services" is included in the Pyramid Diagrams solution from the Marketing area of ConceptDraw Solution Park.
Pyramid diagram

Types of Flowchart - Overview


Basic Flowchart Symbols and Meaning


"Citric acid cycle (tricarboxylic acid cycle, TCA cycle, Krebs cycle) is a series of chemical reactions used by all aerobic organisms to generate energy through the oxidation of acetate derived from carbohydrates, fats and proteins into carbon dioxide and chemical energy in the form of adenosine triphosphate (ATP)." [Citric acid cycle. Wikipedia]
This biochemical diagram example shows metabolic pathways map of citric acid cycle reactions.
This sample was redesigned from the Wikimedia Commons file: TCA cycle.svg. [commons.wikimedia.org/ wiki/ File:TCA_ cycle.svg]
This image is licensed under the Creative Commons Attribution 3.0 Unported license. [creativecommons.org/ licenses/ by/ 3.0/ deed.en]
The metabolic pathway map example "Citric acid cycle (TCA cycle)" was created using the ConceptDraw PRO diagramming and vector drawing software extended with the Biology solution from the Science and Education area of ConceptDraw Solution Park.
Tricarboxylic acid cycle
.png--diagram-flowchart-example.png)
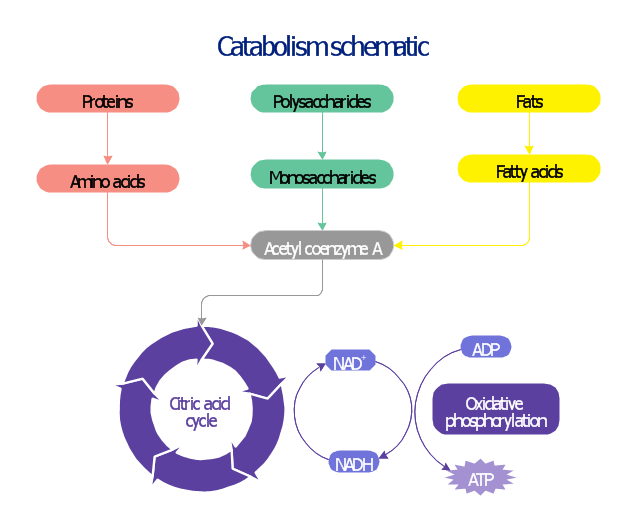
This biochemical chart display how proteins, polysaccharides and fats from food are digested into gastrointestinal tract into aminoacids, monosaccharides and fatty acids, and then broken down and oxidized to carbon dioxide and water in cellular processes of energy generation.
This metabolic pathway map was redesigned from Wikipedia file: Catabolism schematic.svg. [en.wikipedia.org/ wiki/ File:Catabolism_ schematic.svg]
The biochemical diagram example "Catabolism schematic" was created using the ConceptDraw PRO diagramming and vector drawing software extended with the Biology solution from the Science and Education area of ConceptDraw Solution Park.
Catabolic pathway map
Healthy Foods

- Program to Make Flow Chart | Drawing Illustration | Water cycle ...
- Drawing a Nature Scene | Drawing Illustration | Water Cycle | Water ...
- Circular arrows diagram - Quality cycle | Water cycle diagram ...
- Water cycle diagram | Drawing Illustration | Drawing a Nature Scene
- Water cycle diagram | Drawing a Nature Scene | Building Drawing ...
- Drawing Illustration | Drawing a Nature Scene | Water Cycle | Water ...
- Water cycle diagram | Risk diagram (PDPC) template | What is a ...
- Water cycle diagram | Drawing a Nature Scene | Beauty in nature ...
- Water cycle diagram | Drawing a Nature Scene | Diagram Of H20 ...
- Water cycle diagram | Drawing a Nature Scene | Beauty in nature ...
- Water cycle diagram | Drawing a Nature Scene | Nature | Flow ...
- Water cycle diagram | Active indirect water heater diagram | Double ...
- Water cycle diagram
- Restaurant Floor Plan Software | Water cycle diagram | Beauty in ...
- Water Cycle Diagram For Drawing
- Water cycle diagram | Clipart On Water Vapor
- Drawing a Nature Scene | Water Cycle | Diagram Of A H2o Cycle
- Drawing Illustration | Drawing a Nature Scene | Nature | Cycles Of ...
- Drawing Illustration | Drawing a Nature Scene | Nature | Illustration ...
- Water Cycle Chart To Draw