This pie chart sample shows the atmosphere air composition. It was designed on the base of the Wikimedia Commons file: Air composition pie chart.JPG.
[commons.wikimedia.org/ wiki/ File:Air_ composition_ pie_ chart.JPG]
This file is licensed under the Creative Commons Attribution-Share Alike 3.0 Unported license. [creativecommons.org/ licenses/ by-sa/ 3.0/ deed.en]
"The atmosphere of Earth is a layer of gases surrounding the planet Earth that is retained by Earth's gravity. The atmosphere protects life on Earth by absorbing ultraviolet solar radiation, warming the surface through heat retention (greenhouse effect), and reducing temperature extremes between day and night (the diurnal temperature variation).
The common name given to the atmospheric gases used in breathing and photosynthesis is air. By volume, dry air contains 78.09% nitrogen, 20.95% oxygen, 0.93% argon, 0.039% carbon dioxide, and small amounts of other gases. Air also contains a variable amount of water vapor, on average around 1%. Although air content and atmospheric pressure vary at different layers, air suitable for the survival of terrestrial plants and terrestrial animals currently is only known to be found in Earth's troposphere and artificial atmospheres." [Atmosphere of Earth. Wikipedia]
The pie chart example "Atmosphere air composition" was created using the ConceptDraw PRO diagramming and vector drawing software extended with the Pie Charts solution of the Graphs and Charts area in ConceptDraw Solution Park.
Pie chart

This DFD sample was created on the base of the figure from the NASA website. [asd-www.larc.nasa.gov/ ATBD/ DFD.html]
"Clouds and the Earth's Radiant Energy System (CERES).
EOS-Terra: Understanding Earth's Clouds and Climate.
The Clouds and the Earth's Radiant Energy System (CERES) instrument is one of several that will be flown aboard the Earth Observing System's Terra spacecraft, scheduled for launch in late1999. The data from the CERES instrument will be used to study the energy exchanged between the Sun; the Earth's atmosphere, surface and clouds; and outer space.
The CERES EOS-Terra instrument will be the second CERES instrument in Earth orbit. The first CERES instrument is currently orbiting the Earth aboard the Tropical Rainfall Measuring Mission observatory, which was launched in November 1997. Early results of the TRMM mission show that the first CERES has provided better measurement capabilities than any previous satellite instrument of its kind.
What CERES Will Measure.
CERES will measure the energy at the top of the atmosphere, as well as estimate energy levels in the atmosphere and at the Earth's surface. Using information from very high resolution cloud imaging instruments on the same spacecraft, CERES also will determine cloud properties, including cloud amount, altitude, thickness, and the size of the cloud particles. All of these measurements are critical for advancing our understanding of the Earth's total climate system and further improving climate prediction models.
The CERES instrument is based on NASA Langley's highly successful Earth Radiation Budget Experiment (ERBE) which used three satellites to provide global energy budget measurements from 1984 to 1990." [nasa.gov/ centers/ langley/ news/ factsheets/ CERES.html]
The DFD example "CERES data flow diagram" was created using the ConceptDraw PRO diagramming and vector drawing software extended with the Data Flow Diagrams solution from the Software Development area of ConceptDraw Solution Park.
DFD

This ecology infographic example was created on the base of the infographics "Greenhouse gas emissions in the EU" from the Debating Europe website. [debatingeurope.eu/ wp-content/ uploads/ 2013/ 06/ TH_ 2_ social.png]
"A greenhouse gas (sometimes abbreviated GHG) is a gas in an atmosphere that absorbs and emits radiation within the thermal infrared range. This process is the fundamental cause of the greenhouse effect. The primary greenhouse gases in the Earth's atmosphere are water vapor, carbon dioxide, methane, nitrous oxide, and ozone. Greenhouse gases greatly affect the temperature of the Earth; without them, Earth's surface would average about 33 °C colder, which is about 59 °F below the present average of 14 °C (57 °F)." [Greenhouse gas. Wikipedia]
The ecology infographic example "EU greenhouse gas emissions" was created using the ConceptDraw PRO diagramming and vector drawing software extended with the Management Infographics solition from the area "Business Infographics" in ConceptDraw Solution Park.
Ecology infographics example

Used Solutions
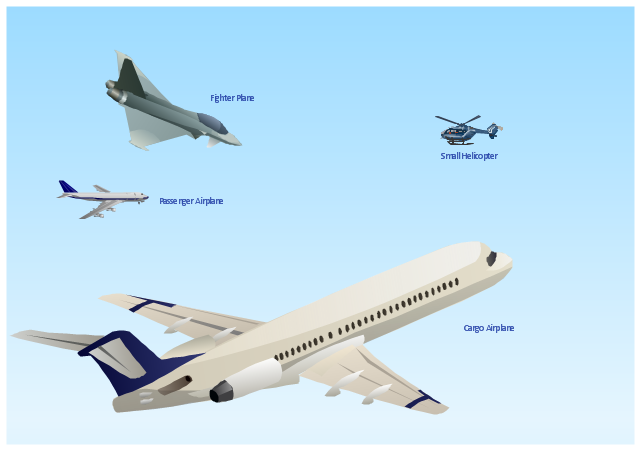
Use vector clipart library Aircraft to illustrate your documents, infographics, presentations and websites with images of aerial vehicles using ConceptDraw PRO diagramming and vector drawing software.
"An aircraft is a machine that is able to fly by gaining support from the air, or, in general, the atmosphere of a planet. It counters the force of gravity by using either static lift or by using the dynamic lift of an airfoil, or in a few cases the downward thrust from jet engines.
The human activity that surrounds aircraft is called aviation. Crewed aircraft are flown by an onboard pilot, but unmanned aerial vehicles may be remotely controlled or self-controlled by onboard computers." [Aircraft. Wikipedia]
The vector stencils library Aircraft is included in the Aerospace and Transport solution from Illustration area of ConceptDraw Solution Park.
Vector illustration
This Water cycle diagram example was drawn using the ConceptDraw PRO diagramming and vector graphics software extended with the clipart libraries Geography and Weather.
"The water cycle, also known as the hydrologic cycle or the H2O cycle, describes the continuous movement of water on, above and below the surface of the Earth. The mass water on Earth remains fairly constant over time but the partitioning of the water into the major reservoirs of ice, fresh water, saline water and atmospheric water is variable depending on a wide range of climatic variables. The water moves from one reservoir to another, such as from river to ocean, or from the ocean to the atmosphere, by the physical processes of evaporation, condensation, precipitation, infiltration, runoff, and subsurface flow. In so doing, the water goes through different phases: liquid, solid (ice), and gas (vapor)." [Water cycle. Wikipedia]
This water cycle diagram example is included in the Nature solution from the Illustration area of ConceptDraw Solution Park.
Vector illustration

The vector stencils library "Weather" contains 17 weather clipart images for drawing illustrations on climate to show cloudiness, air temperature, precipitation, wind.
"Weather is the state of the atmosphere, to the degree that it is hot or cold, wet or dry, calm or stormy, clear or cloudy. Most weather phenomena occur in the troposphere, just below the stratosphere. Weather generally refers to day-to-day temperature and precipitation activity, whereas climate is the term for the average atmospheric conditions over longer periods of time. When used without qualification, "weather", is generally understood to mean the weather of Earth.
Weather is driven by air pressure (temperature and moisture) differences between one place and another. These pressure and temperature differences can occur due to the sun angle at any particular spot, which varies by latitude from the tropics. The strong temperature contrast between polar and tropical air gives rise to the jet stream. Weather systems in the mid-latitudes, such as extratropical cyclones, are caused by instabilities of the jet stream flow. Because the Earth's axis is tilted relative to its orbital plane, sunlight is incident at different angles at different times of the year. On Earth's surface, temperatures usually range ±40°C (−40°F to 100°F) annually. Over thousands of years, changes in Earth's orbit affect the amount and distribution of solar energy received by the Earth and influence long-term climate and global climate change." [Weather. Wikipedia]
The clip art example "Weather - Vector stencils library" was created using the ConceptDraw PRO diagramming and vector drawing software extended with the Nature solution from the Illustration area of ConceptDraw Solution Park.
www.conceptdraw.com/ solution-park/ illustrations-nature
Sunny

Cloudy

Overcast

Snow

Rain

Lightning

Hot

Warm

Frost

Mist

Strong wind

Flood

Tsunami

Dew

Hoar-frost

Earthquake

Snowflake

The vector stencils library Weather contains 17 symbols of meteorological conditions: sunny, cloudy, overcast, snow, rain, lighting, hot, warm, cold, mist, strong wind, flood, tsunami, dew, hoarfrost, earthquake, snowflake.
Use the design elements library Weather to draw illustrations, calendars, maps and infographics with weather phenomena clipart using the ConceptDraw PRO diagramming and vector graphics software.
"Weather is the state of the atmosphere, to the degree that it is hot or cold, wet or dry, calm or stormy, clear or cloudy. Most weather phenomena occur in the troposphere, just below the stratosphere. Weather generally refers to day-to-day temperature and precipitation activity, whereas climate is the term for the average atmospheric conditions over longer periods of time. When used without qualification, "weather" is understood to mean the weather of Earth." [Weather. Wikipedia]
This example of weather clipart is included in the Nature solution from the Illustration area of ConceptDraw Solution Park.
Vector clip art

Beauty in nature Illustrations and Clipart

- Atmosphere air composition | Percentage Pie Chart. Pie Chart ...
- Atmosphere air composition | Water cycle diagram | Percentage Pie ...
- Atmosphere air composition | Water cycle diagram | Weather ...
- Atmosphere air composition | Pie Chart Examples and Templates ...
- Atmosphere air composition | Pie Chart Of The Main Gases That ...
- Atmosphere air composition | Pie Chart | Pie Chart Examples and ...
- Atmosphere air composition | Air handler- HVAC plan | Central air ...
- Atmosphere air composition | Weather - Vector stencils library ...
- Atmosphere air composition | LLNL Flow Charts | Cross-Functional ...