This pie chart sample shows the atmosphere air composition. It was designed on the base of the Wikimedia Commons file: Air composition pie chart.JPG.
[commons.wikimedia.org/ wiki/ File:Air_ composition_ pie_ chart.JPG]
This file is licensed under the Creative Commons Attribution-Share Alike 3.0 Unported license. [creativecommons.org/ licenses/ by-sa/ 3.0/ deed.en]
"The atmosphere of Earth is a layer of gases surrounding the planet Earth that is retained by Earth's gravity. The atmosphere protects life on Earth by absorbing ultraviolet solar radiation, warming the surface through heat retention (greenhouse effect), and reducing temperature extremes between day and night (the diurnal temperature variation).
The common name given to the atmospheric gases used in breathing and photosynthesis is air. By volume, dry air contains 78.09% nitrogen, 20.95% oxygen, 0.93% argon, 0.039% carbon dioxide, and small amounts of other gases. Air also contains a variable amount of water vapor, on average around 1%. Although air content and atmospheric pressure vary at different layers, air suitable for the survival of terrestrial plants and terrestrial animals currently is only known to be found in Earth's troposphere and artificial atmospheres." [Atmosphere of Earth. Wikipedia]
The pie chart example "Atmosphere air composition" was created using the ConceptDraw PRO diagramming and vector drawing software extended with the Pie Charts solution of the Graphs and Charts area in ConceptDraw Solution Park.
Pie chart

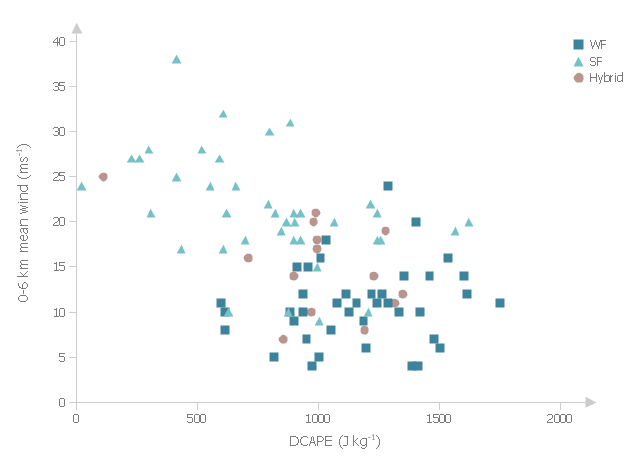
This example was drawn on the base of fig. 13 "Scatter plot of DCAPE versus 0-6 km mean wind" from the article "Examination of Derecho Environments Using Proximity Soundings" by Jeffry S. Evans on the website of Storm Prediction Center, National Oceanic and Atmospheric Administration.
"Figure 13 suggests the existence of an inverse relationship between DCAPE and mean wind when considering all derechos. Careful examination of this figure shows that this is the result of the separation into SF, WF, and hybrid categories; the SF cases are found in the upper left part of the figure, the WF cases are found in the lower right part, and the hybrid cases are in between, with some hint that they are more like the WF cases than the SF cases." [spc.noaa.gov/ publications/ evans/ bowpaper/ bowpaper.htm]
"In stratified sampling, the population is partitioned into non-overlapping groups, called strata and a sample is selected by some design within each stratum. ...
The principal reasons for using stratified random sampling rather than simple random sampling include:
1. Stratification may produce a smaller error of estimation than would be produced by a simple random sample of the same size. This result is particularly true if measurements within strata are very homogeneous.
2. The cost per observation in the survey may be reduced by stratification of the population elements into convenient groupings.
3. Estimates of population parameters may be desired for subgroups of the population. These subgroups should then be identified." [onlinecourses.science.psu.edu/ stat506/ node/ 27]
The multiserial scatterplot "Starification diagram example" was created using the ConceptDraw PRO software extended with the Seven Basic Tools of Quality solution from the Quality area of ConceptDraw Solution Park.
Multiserial scatterplot
 Chemistry
This solution extends ConceptDraw DIAGRAM software with samples, template and libraries of vector stencils for drawing the Chemistry Illustrations for science and education.
This calendar sample was drawn on the base of figure illustrating the webpage "CASIE; Mission Schedule" from the NASA website.
[espo.nasa.gov/ casie/ schedule.php]
"The Ames Earth Science Project Office is a small group of success-oriented individuals providing project management for NASA's Science Mission Directorate field research. We provide planning, implementation and post mission support for large, complex, multi-agency, national and international field campaigns.
We have a long history of successful field campaigns, beginning in 1987 with both the Stratosphere-Troposphere Exchange Project (STEP) and the Airborne Antarctic Ozone Expedition (AAOE) experiments. Our primary customer has been NASA's Upper Atmosphere Research Program, but in recent years our customers have included the Atmospheric Chemistry and Modeling Analysis Program, the Tropospheric Chemistry Program, the Radiation Sciences Program, Atmospheric Dynamics and Remote Sensing, the Airborne Science Program, and the EOS satellite validation program." [espo.nasa.gov]
The calendar example "NASA ESPO - Casie - Mission schedule (June 2009)" was created using the ConceptDraw PRO diagramming and vector drawing software extended with the Calendars solution from the Management area of ConceptDraw Solution Park.
Calendar
.png--diagram-flowchart-example.png)
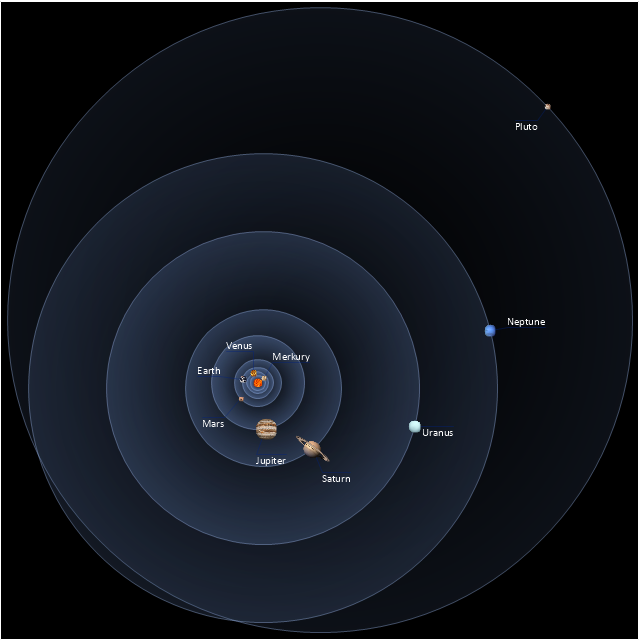
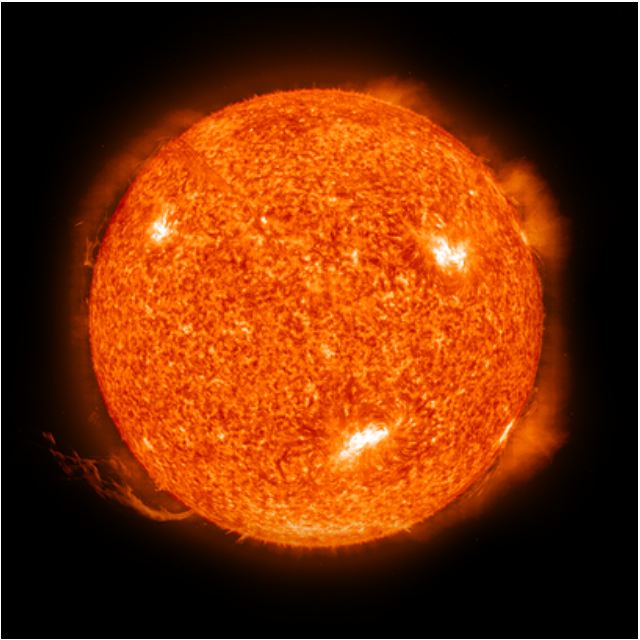
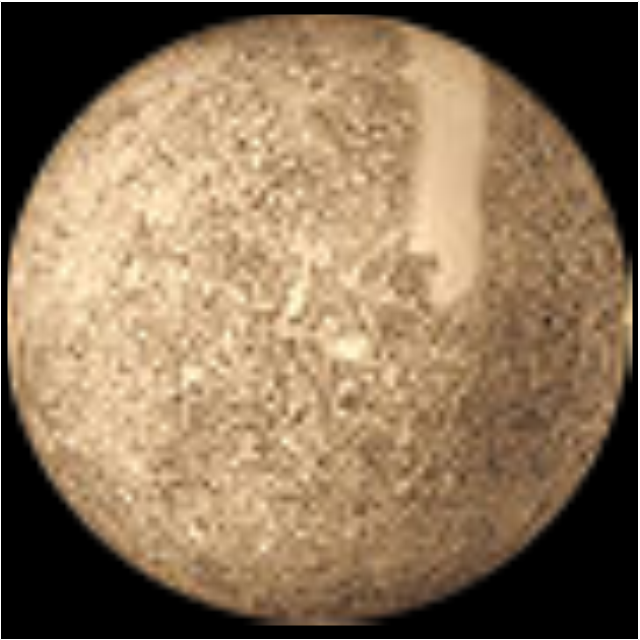
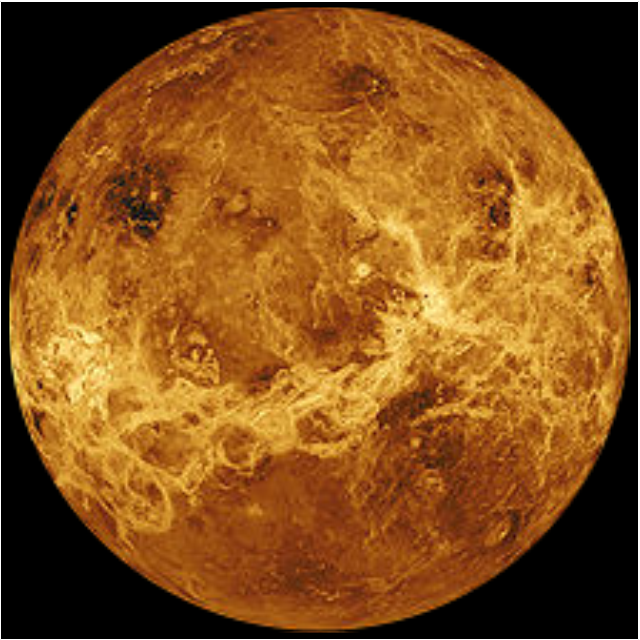
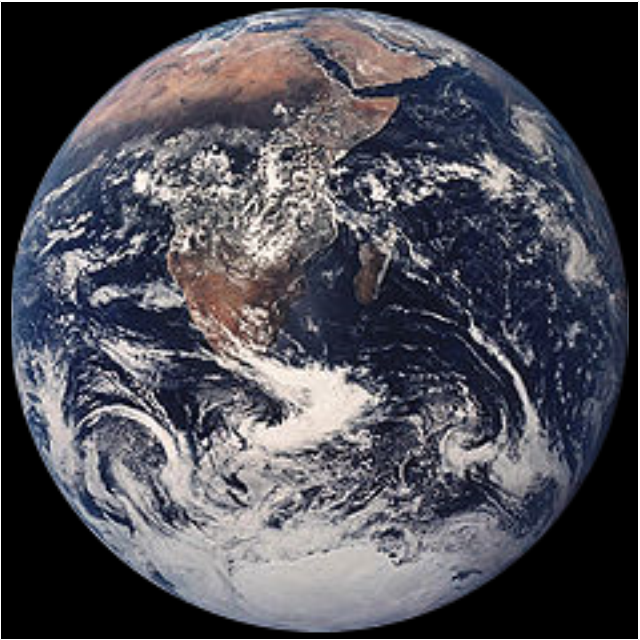
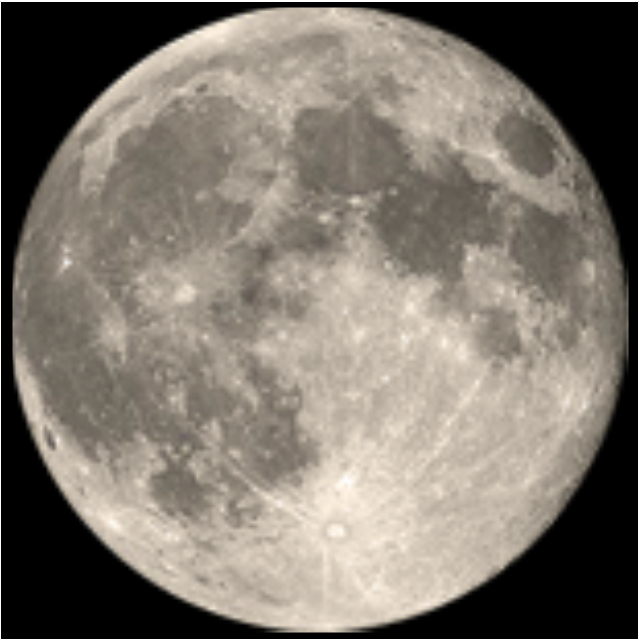
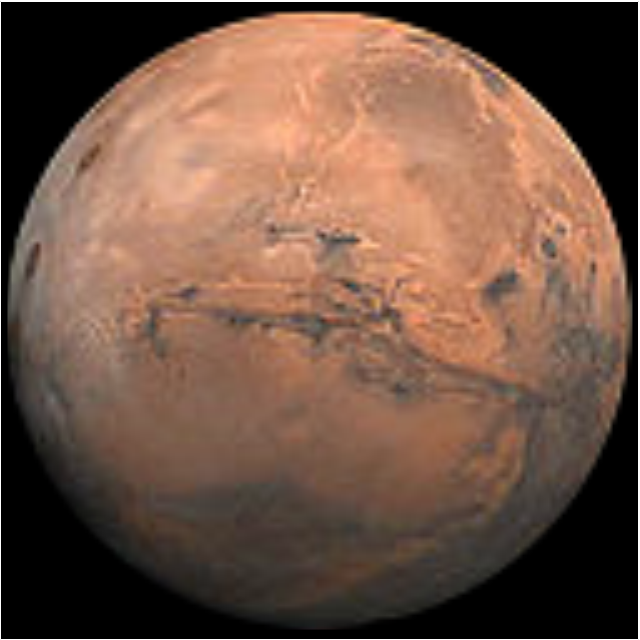
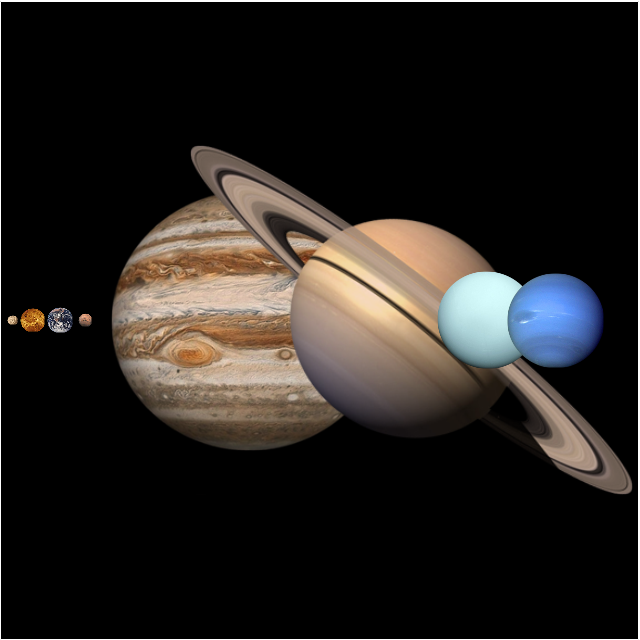
This vector stencils library contains 30 clipart images and astronomical symbols of sun and stars, solar system planets and moon.
Use these shapes for drawing your astronomical diagrams and illustrations.
Use these shapes for drawing your astronomical diagrams and illustrations.
Solar system
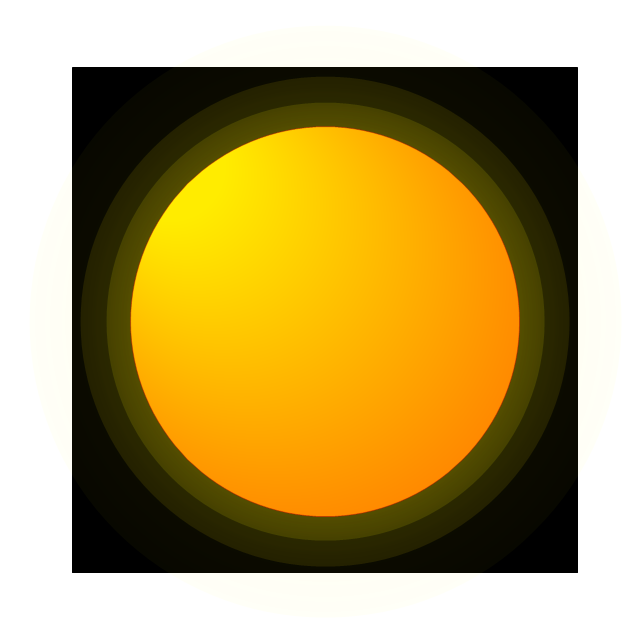
Sun
Mercury
Venus
Earth
Moon
Mars
Jupiter
Saturn
Uranus
Neptune
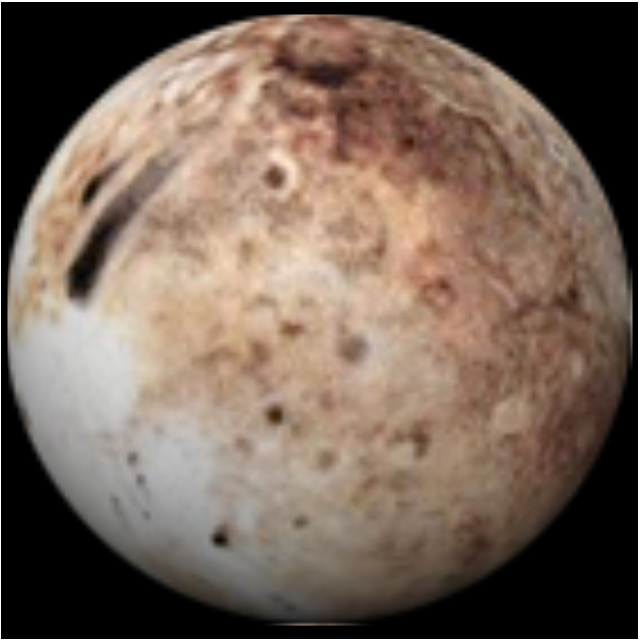
Pluto
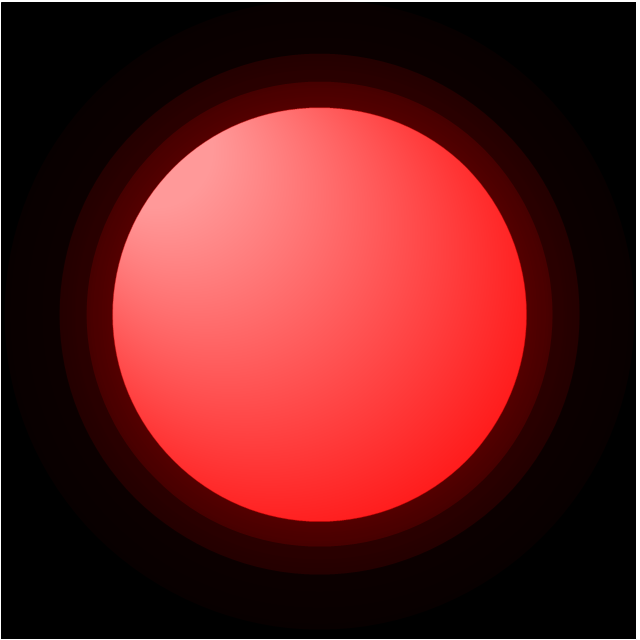
Red giant
Yellow giant
Blue giant

Red dwarf
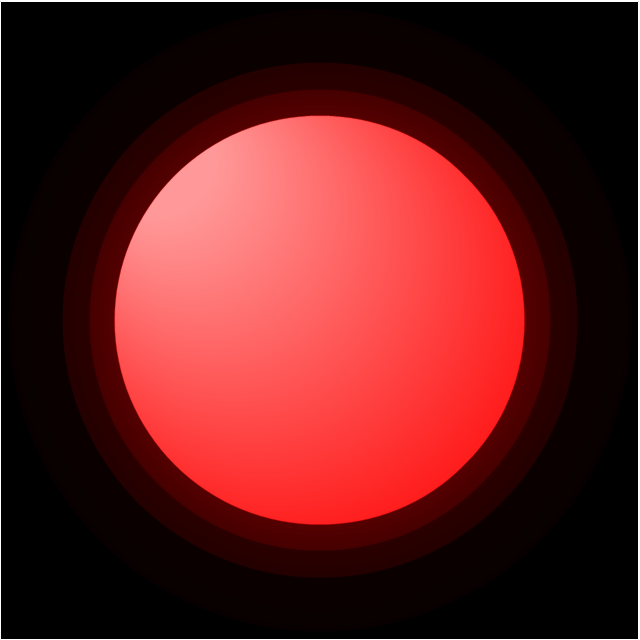
White dwarf

Black hole
Planets to scale
Sun symbol
Mercury symbol
Venus symbol

Earth symbol
Moon symbol

Mars symbol
Jupiter symbol

Saturn symbol

Neptune symbol
Uranus symbol
Pluto symbol

This Water cycle diagram example was drawn using the ConceptDraw PRO diagramming and vector graphics software extended with the clipart libraries Geography and Weather.
"The water cycle, also known as the hydrologic cycle or the H2O cycle, describes the continuous movement of water on, above and below the surface of the Earth. The mass water on Earth remains fairly constant over time but the partitioning of the water into the major reservoirs of ice, fresh water, saline water and atmospheric water is variable depending on a wide range of climatic variables. The water moves from one reservoir to another, such as from river to ocean, or from the ocean to the atmosphere, by the physical processes of evaporation, condensation, precipitation, infiltration, runoff, and subsurface flow. In so doing, the water goes through different phases: liquid, solid (ice), and gas (vapor)." [Water cycle. Wikipedia]
This water cycle diagram example is included in the Nature solution from the Illustration area of ConceptDraw Solution Park.
Vector illustration

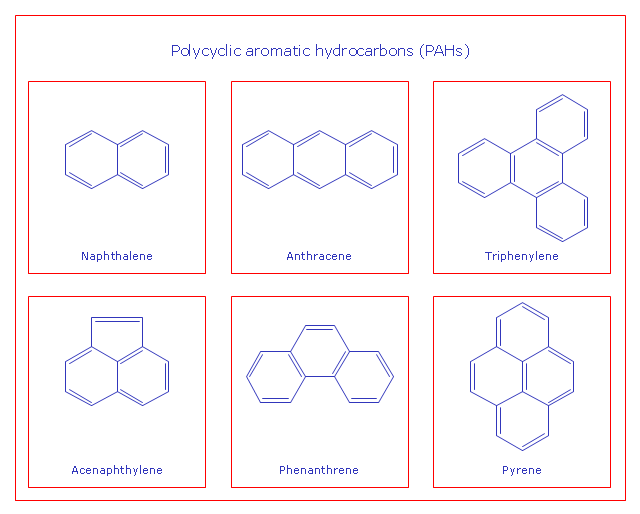
This chemical drawing example shows structural formulas of organic molecules - polycyclic aromatic hydrocarbons (PAHs), also known as poly-aromatic hydrocarbons or polynuclear aromatic hydrocarbons: naphthalene, anthracene, triphenylene, acenaphthylene, phenanthrene, pyrene.
"Polycyclic aromatic hydrocarbons (PAHs), also known as poly-aromatic hydrocarbons or polynuclear aromatic hydrocarbons, are fused aromatic rings and do not contain heteroatoms or carry substituents. Naphthalene is the simplest example of a PAH. PAHs occur in oil, coal, and tar deposits, and are produced as byproducts of fuel burning (whether fossil fuel or biomass).
They are potent atmospheric pollutants. Some compounds have been identified as carcinogenic, mutagenic, and teratogenic. PAHs are also found in cooked foods. Studies have shown that high levels of PAHs are found, for example, in meat cooked at high temperatures such as grilling or barbecuing, and in smoked fish.
They are also found in the interstellar medium, in comets, and in meteorites and are a candidate molecule to act as a basis for the earliest forms of life." [Polycyclic aromatic hydrocarbon. Wikipedia]
The chemical drawing example "PAH compounds" was created using the ConceptDraw PRO diagramming and vector drawing software extended with the Chemistry solution from the Science and Education area of ConceptDraw Solution Park.
PAH compounds
The vector stencils library "Weather" contains 17 weather clipart images for drawing illustrations on climate to show cloudiness, air temperature, precipitation, wind.
"Weather is the state of the atmosphere, to the degree that it is hot or cold, wet or dry, calm or stormy, clear or cloudy. Most weather phenomena occur in the troposphere, just below the stratosphere. Weather generally refers to day-to-day temperature and precipitation activity, whereas climate is the term for the average atmospheric conditions over longer periods of time. When used without qualification, "weather", is generally understood to mean the weather of Earth.
Weather is driven by air pressure (temperature and moisture) differences between one place and another. These pressure and temperature differences can occur due to the sun angle at any particular spot, which varies by latitude from the tropics. The strong temperature contrast between polar and tropical air gives rise to the jet stream. Weather systems in the mid-latitudes, such as extratropical cyclones, are caused by instabilities of the jet stream flow. Because the Earth's axis is tilted relative to its orbital plane, sunlight is incident at different angles at different times of the year. On Earth's surface, temperatures usually range ±40°C (−40°F to 100°F) annually. Over thousands of years, changes in Earth's orbit affect the amount and distribution of solar energy received by the Earth and influence long-term climate and global climate change." [Weather. Wikipedia]
The clip art example "Weather - Vector stencils library" was created using the ConceptDraw PRO diagramming and vector drawing software extended with the Nature solution from the Illustration area of ConceptDraw Solution Park.
www.conceptdraw.com/ solution-park/ illustrations-nature
Sunny

Cloudy

Overcast

Snow

Rain

Lightning

Hot

Warm

Frost

Mist

Strong wind

Flood

Tsunami

Dew

Hoar-frost

Earthquake

Snowflake

The vector stencils library Weather contains 17 symbols of meteorological conditions: sunny, cloudy, overcast, snow, rain, lighting, hot, warm, cold, mist, strong wind, flood, tsunami, dew, hoarfrost, earthquake, snowflake.
Use the design elements library Weather to draw illustrations, calendars, maps and infographics with weather phenomena clipart using the ConceptDraw PRO diagramming and vector graphics software.
"Weather is the state of the atmosphere, to the degree that it is hot or cold, wet or dry, calm or stormy, clear or cloudy. Most weather phenomena occur in the troposphere, just below the stratosphere. Weather generally refers to day-to-day temperature and precipitation activity, whereas climate is the term for the average atmospheric conditions over longer periods of time. When used without qualification, "weather" is understood to mean the weather of Earth." [Weather. Wikipedia]
This example of weather clipart is included in the Nature solution from the Illustration area of ConceptDraw Solution Park.
Vector clip art

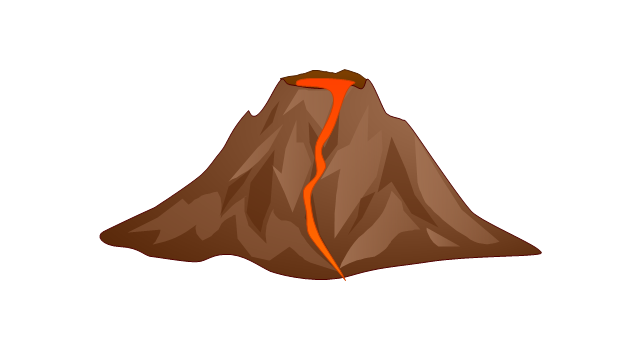
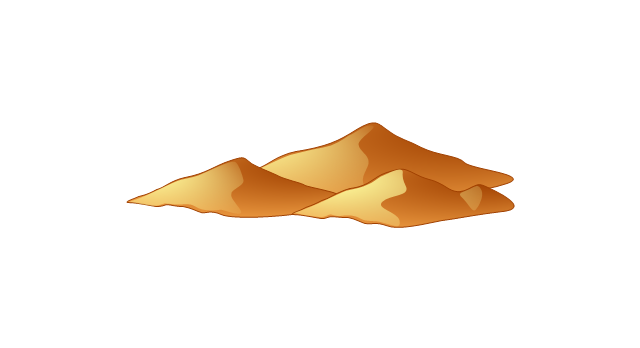
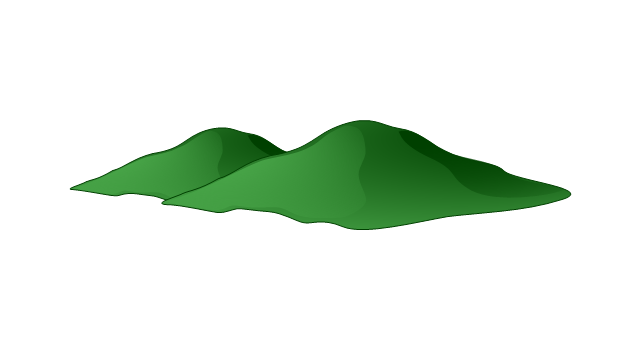
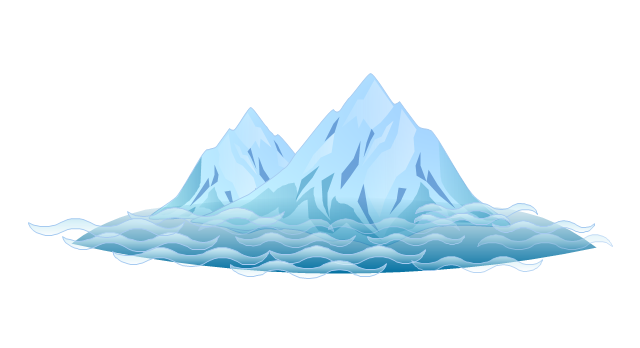
The vector stencils library "Geography" contains 14 clipart images of natural landscapes and water features for drawing illustrations.
"A natural landscape is a landscape that is unaffected by human activity. A natural landscape is intact when all living and nonliving elements are free to move and change. The nonliving elements distinguish a natural landscape from a wilderness. A wilderness includes areas within which natural processes operate without human interference, but a wilderness must contain life. As implied, a natural landscape may contain either the living or nonliving or both." [Natural landscape. Wikipedia]
The clip art example "Geography - Vector stencils library" was created using the ConceptDraw PRO diagramming and vector drawing software extended with the Nature solution from the Illustration area of ConceptDraw Solution Park.
www.conceptdraw.com/ solution-park/ illustrations-nature
Ocean
Forest
River
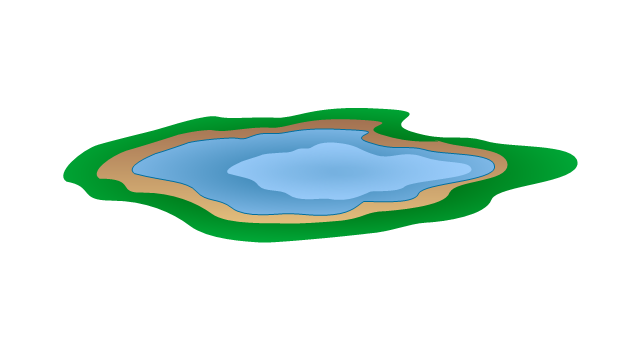
Lake
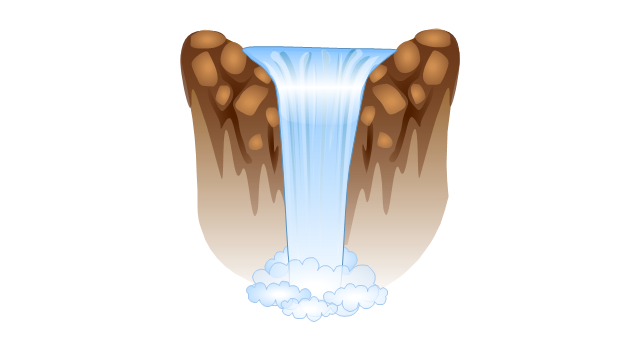
Waterfall
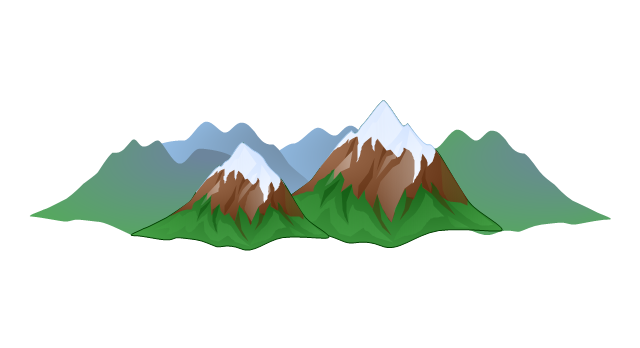
Mountains
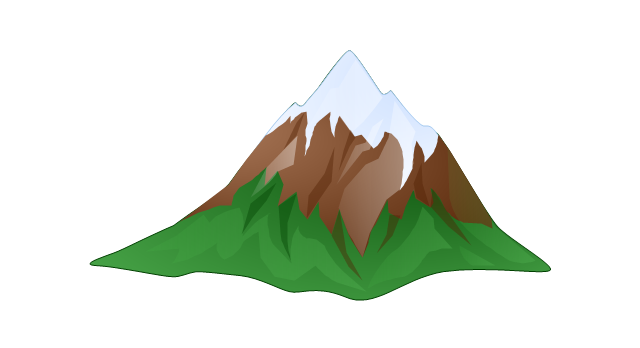
Mountain
Ravine

Volcano
Desert
Hills
Iceberg
Conifer tree

Tree

- Atmosphere air composition | Percentage Pie Chart. Pie Chart ...
- Percentage Pie Chart. Pie Chart Examples | Atmosphere air ...
- Atmosphere air composition | Pie Chart Examples and Templates ...
- Atmosphere air composition | Pie Charts | Percentage Pie Chart. Pie ...
- Atmosphere air composition | Water cycle diagram | Percentage Pie ...
- Atmosphere Gases Pie Chart
- Atmosphere air composition | Air Composition Pie Chart
- A Pie Chart Of The Atmosphere
- Pie Graph Of Atmosphere Gases