Flow chart Example. Warehouse Flowchart


 Logistics Flow Charts
Logistics Flow Charts solution extends ConceptDraw PRO v11 functionality with opportunities of powerful logistics management software. It provides large collection of predesigned vector logistic symbols, pictograms, objects and clipart to help you design with pleasure Logistics flow chart, Logistics process flow diagram, Inventory flow chart, Warehouse flowchart, Warehouse management flow chart, Inventory control flowchart, or any other Logistics diagram. Use this solution for logistics planning, to reflect logistics activities and processes of an enterprise or firm, to depict the company's supply chains, to demonstrate the ways of enhancing the economic stability on the market, to realize logistics reforms and effective products' promotion.
HelpDesk
How to Make a Logistics Flow Chart

Process Flowchart


 Plant Layout Plans
This solution extends ConceptDraw PRO v.9.5 plant layout software (or later) with process plant layout and piping design samples, templates and libraries of vector stencils for drawing Plant Layout plans. Use it to develop plant layouts, power plant desig
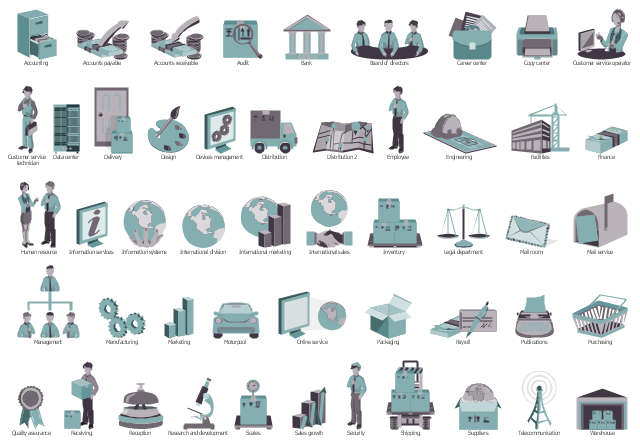
The vector stencils library "Workflow departments" contains 47 icons.
Use it to design your business process workflow diagrams with ConceptDraw PRO software.
"Departmentalization ...
Division of labour creates specialists who need coordination. This coordination is facilitated by grouping specialists together in departments. ...
Functional departmentalization - Grouping activities by functions performed. Activities can be grouped according to function (work being done) to pursue economies of scale by placing employees with shared skills and knowledge into departments for example human resources, IT, accounting, manufacturing, logistics, and engineering. Functional departmentalization can be used in all types of organizations. ...
Process departmentalization - Grouping activities on the basis of product or service or customer flow. Because each process requires different skills, process departmentalization allows homogenous activities to be categorized. For example, the applicants might need to go through several departments namely validation, licensing and treasury, before receiving the driver’s license." [Departmentalization. Wikipedia]
The icons example "Design elements - Workflow departments" is included in the Business Process Workflow Diagrams solution from the Business Processes area of ConceptDraw Solution Park.
Department icons
 Logistic Dashboard
The powerful tools of Logistic Dashboard solution and specially developed live graphic objects of logistic icons, logistic navigation elements, logistic indicators, logistic charts and logistic maps effectively assist in designing Logistic dashboards, Logistic maps, Logistic charts, diagrams and infographics. The included set of prebuilt samples and quick-start templates, demonstrates the power of ConceptDraw PRO software in logistics management, its assisting abilities in development, realization and analyzing the logistic processes, as well as in perfection the methods of logistics management.
The vector stencils library "HR department" contains 49 department symbols.
Use it to design your HR flowcharts, workflow diagrams and process charts by the ConceptDraw PRO diagramming and vector drawing software.
"Functional departmentalization - Grouping activities by functions performed. Activities can be grouped according to function (work being done) to pursue economies of scale by placing employees with shared skills and knowledge into departments for example human resources, IT, accounting, manufacturing, logistics, and engineering. Functional departmentalization can be used in all types of organizations." [Departmentalization. Wikipedia]
The shapes example "Design elements - HR department" is included in the HR Flowcharts solution from the Management area of ConceptDraw Solution Park.
Department symbols for HR workflow diagrams
HelpDesk
How to Make a Logistic Dashboard

UML Class Diagram Example for Transport System

Business Process Modeling Notation

 Data Flow Diagrams (DFD)
Data Flow Diagrams solution extends ConceptDraw PRO software with templates, samples and libraries of vector stencils for drawing the data flow diagrams (DFD).
Types of Flowcharts


 Flowcharts
The Flowcharts solution for ConceptDraw PRO is a comprehensive set of examples and samples in several varied color themes for professionals that need to represent graphically a process. Solution value is added by the basic flow chart template and shapes' libraries of flowchart notation. ConceptDraw PRO flow chart creator lets one depict the processes of any complexity and length, as well as design the Flowchart either vertically or horizontally.
 Event-driven Process Chain Diagrams
Event-driven Process Chain (EPC) Diagram is a type of flowchart widely used for modeling in business engineering and reengineering, business process improvement, and analysis. EPC method was developed within the Architecture of Integrated Information Systems (ARIS) framework.
- Flow chart Example. Warehouse Flowchart | Basic Audit Flowchart ...
- Logistics Workflow
- Process Flowchart | Flow chart Example. Warehouse Flowchart ...
- Process Flowchart | Flow chart Example. Warehouse Flowchart ...
- Process Flowchart | Flow chart Example. Warehouse Flowchart | Site ...
- Process Flowchart | Flow chart Example. Warehouse Flowchart ...
- Flow chart Example. Warehouse Flowchart | Packaging, loading ...
- Process Flowchart | Flow chart Example. Warehouse Flowchart ...
- Logistics Flow Charts | Process Flowchart | How to Make a Logistics ...
- Flow chart Example. Warehouse Flowchart | Process Flowchart ...
- Process Flowchart | Logistics Flow Charts | Flow chart Example ...
- Process Flowchart | Flow chart Example. Warehouse Flowchart ...
- Flow chart Example. Warehouse Flowchart | Process Flowchart ...
- Logistics - Choreography BPMN 2.0 diagram | Flow chart Example ...
- Process Flowchart | Flow chart Example. Warehouse Flowchart ...
- Process Flowchart | Flow chart Example. Warehouse Flowchart ...
- Flow chart Example. Warehouse Flowchart | Logistics Flow Charts ...
- Process Flowchart | Flow chart Example. Warehouse Flowchart ...
- Process Flowchart | Flow chart Example. Warehouse Flowchart ...
- Flow chart Example. Warehouse Flowchart | Interactive Voice ...