Visual Presentations Made Easy with Diagramming Software


Presentations in Educational Process

HelpDesk
How to Draw a Divided Bar Chart

Simple Drawing Applications for Mac

Basic Diagramming


Venn Diagram Examples for Problem Solving. Environmental Social Science. Human Sustainability Confluence

Basic Diagramming

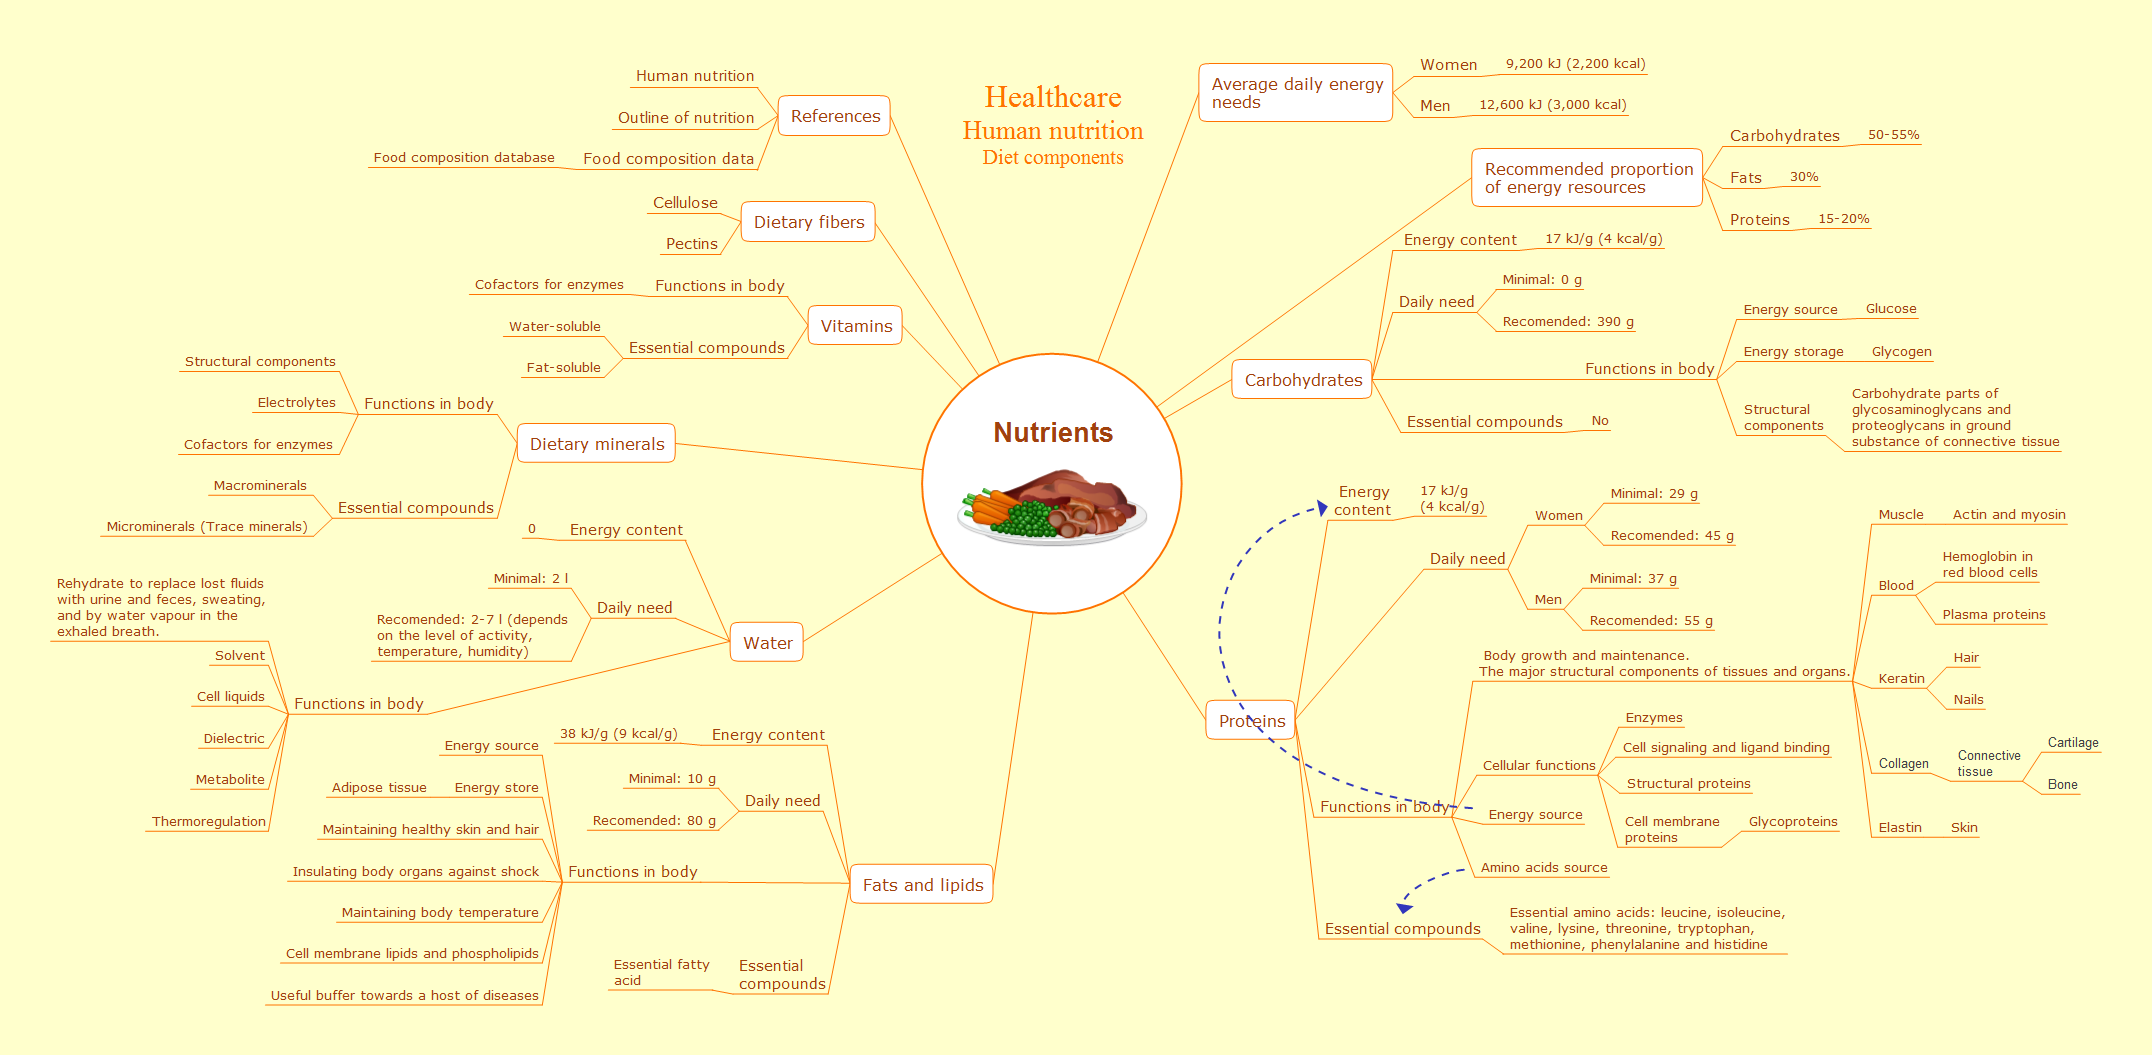
Concept Maps

 Picture Graphs
Typically, a Picture Graph has very broad usage. They many times used successfully in marketing, management, and manufacturing. The Picture Graphs Solution extends the capabilities of ConceptDraw DIAGRAM with templates, samples, and a library of professionally developed vector stencils for designing Picture Graphs.
Block Diagram

Skype - eLearning Learning
Communication Tool for Remote Project Management

 eLearning for Skype
This solution extends ConceptDraw MINDMAP software with the ability to prepare and run remote learning sessions by using Skype
Flowchart Software


Basic Diagramming

- ConceptDraw Solution Park | Visual Presentations Made Easy with ...
- Visual Presentations Made Easy with Diagramming Software | How ...
- Visual Presentations Made Easy with Diagramming Software | Basic ...
- Visual Presentations Made Easy with Diagramming Software | The ...
- Flowchart Software | TQM Software — Build Professional TQM ...
- Venn Diagram Presentation
- Basic Flowchart Symbols and Meaning | Visual Presentations Made ...
- Scatter Chart Examples | How to Create a Scatter Chart | Line Graph ...
- New Product Launch Presentation Examples
- How to Support Your Mind Map with Visual Elements | Design ...
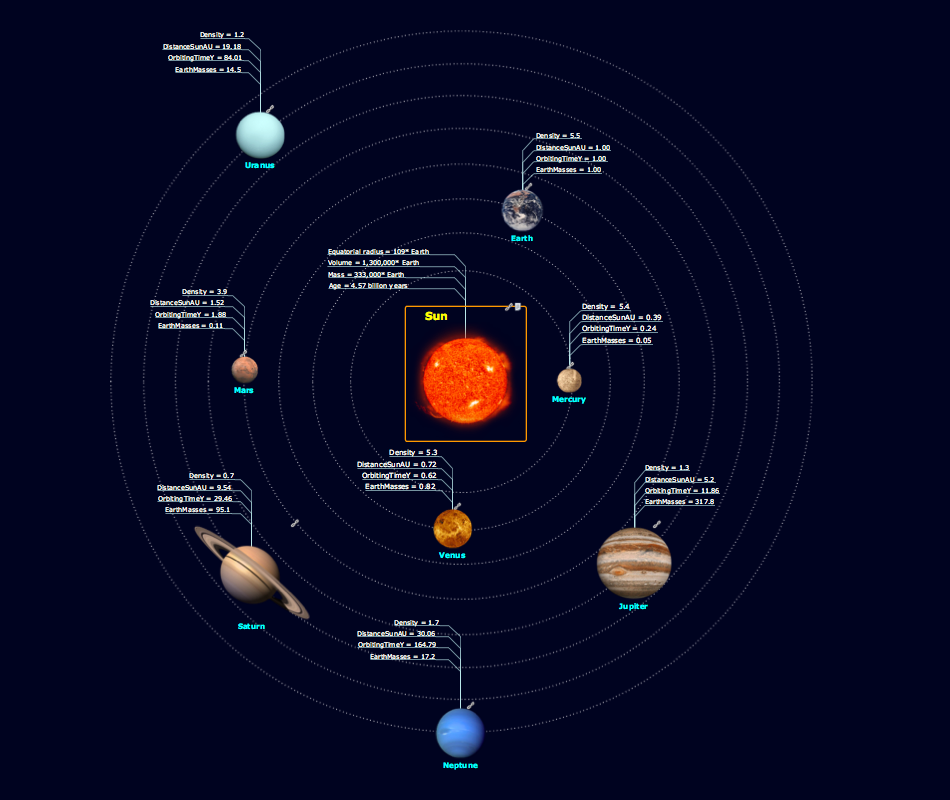
- How to Support Your Mind Map with Visual Elements | Physics ...
- Project —Task Trees and Dependencies | Software Work Flow ...
- Chart Maker for Presentations | Best Multi-Platform Diagram ...
- Create a Presentation Using a Design Template
- Total value of manufacturers' shipments - Arrow graph | Simple ...
- Project Management Project Sample
- Project Management Sample
- Bar Chart Template for Word | Column Chart Template | Chart Maker ...
- How to Draw a Histogram in ConceptDraw PRO | Best Program to ...
- How to Add a Block Diagram to a PowerPoint Presentation Using ...