Process Flowchart


Identifying Quality Management System

 Aerospace and Transport
This solution extends ConceptDraw PRO software with templates, samples and library of vector clipart for drawing the Aerospace and Transport Illustrations. It contains clipart of aerospace objects and transportation vehicles, office buildings and anci
 Entity-Relationship Diagram (ERD)
Entity-Relationship Diagram (ERD) solution extends ConceptDraw PRO software with templates, samples and libraries of vector stencils from drawing the ER-diagrams by Chen's and crow’s foot notations.
 Vehicular Networking
The Vehicular Networking solution extends the ConceptDraw PRO software functionality with specialized tools, wide variety of pre-made vector objects, collection of samples and templates in order to help network engineers design vehicular network diagrams for effective network engineering activity, visualize vehicular networks, develop smart transportation systems, design various types of vehicle network management diagrams, regional network diagrams, vehicular communication system diagrams, vehicular ad-hoc networks, vehicular delay-tolerant networks, and other network engineering schemes.
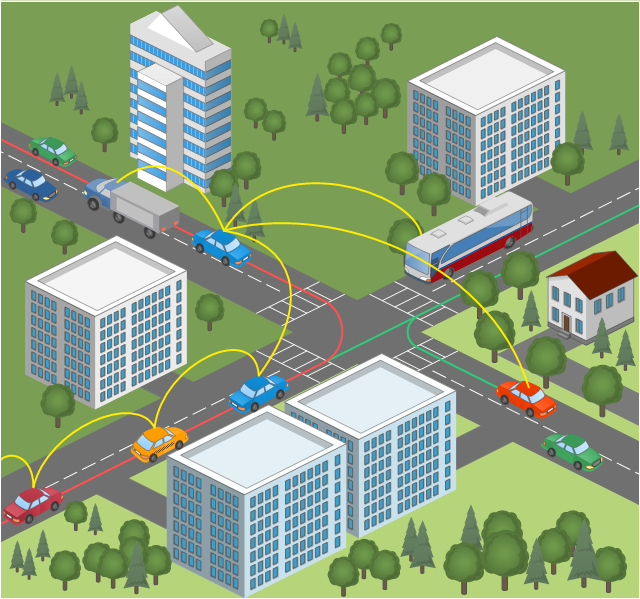
This vehicular network diagram sample was drawn on the base of picture illustrating the post "Intelligent transportation system" from the blog "Technology New Here".
"Intelligent transportation systems are projects that aim to integrate modern communication and information technology into existing transportation management systems in order to optimize vehicle life, fuel efficiency, safety, and traffic in urbanized cities.
The need for intelligent transportation systems stems from the fact that traffic congestion has been increasing all around the world because of increasing population, increasing amount of transportation vehicles and increasing urbanization."
[technologynewhere.wordpress.com/ 2010/ 05/ 12/ intelligent-transportation-system/ ]
The vehicular network diagram example "Intelligent transportation system" was created using the ConceptDraw PRO diagramming and vector drawing software extended with the Vehicular Networking solution from the Computer and Networks area of ConceptDraw Solution Park.
Vehicular network diagram
Used Solutions
UML Use Case Diagram Example Registration System

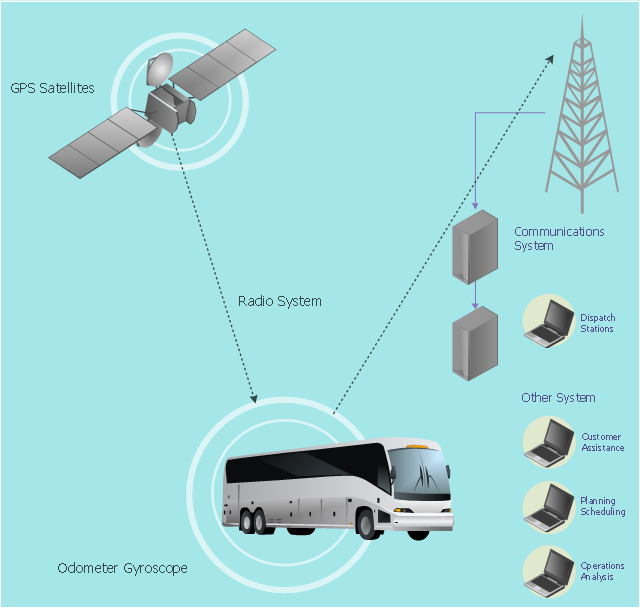
This vehicular network diagram example was drawn on the base of picture illustrating the article "Automatic Vehicle Location: Rural Transit" from the website of the Research and Innovative Technology Administration (RITA), U.S. Department of Transportation (US DOT).
"Automatic Vehicle Location (AVL) systems calculate the real-time location of any vehicle equipped with a Global Positioning Satellite (GPS) receiver. Data are then transmitted to the transit center with use of radio or cellular communications and can be used immediately for daily operations as well as archived for further analysis.
As a stand-alone technology, an AVL system can be used to monitor on-time performance. When combined with other technologies, AVL can deliver many benefits in the areas of fleet management, service planning, safety and security, traveler information, fare payment, vehicle component monitoring, and data collection. Since the greatest benefits from AVL are achieved by combining it with other Intelligent Transportation System (ITS) technologies, AVL is most appropriate for large rural agencies with more than 30 vehicles that plan to implement a comprehensive ITS."
[pcb.its.dot.gov/ factsheets/ avl/ avlRural_ overview.asp]
The vehicular network diagram example "Automatic vehicle location" was created using the ConceptDraw PRO diagramming and vector drawing software extended with the Vehicular Networking solution from the Computer and Networks area of ConceptDraw Solution Park.
Vehicular network diagram
Used Solutions
Types of Flowchart - Overview


 Event-driven Process Chain Diagrams
Event-driven Process Chain (EPC) Diagram is a type of flowchart widely used for modeling in business engineering and reengineering, business process improvement, and analysis. EPC method was developed within the Architecture of Integrated Information Systems (ARIS) framework.
Project management - Design Elements

 Manufacturing and Maintenance
Manufacturing and maintenance solution extends ConceptDraw PRO software with illustration samples, templates and vector stencils libraries with clip art of packaging systems, industrial vehicles, tools, resources and energy.
Best Value — Total Quality Management

Organizational Structure Total Quality Management

Road Transport - Design Elements

- Process Flowchart | Identifying Quality Management System | Er ...
- Activity Diagram For Vehicle Tracking System
- Aerospace and Transport | Vehicle Tracking System Activity Diagram
- UML Use Case Diagram Example Registration System
- Activity Diagram For Vehicle Management System
- Process Flowchart | Identifying Quality Management System ...
- Entity Relationship Diagram For Vehicle Management System
- Process Flowchart | Vehicle Management System For Gui Diagram
- GPS operation diagram | Telecommunication Network Diagrams ...
- Vehicle Management System Project Er Diagram
- Intelligent transportation system | Global vehicular network diagram ...
- Vehicle Management System Activity Diagrams
- Activity Diagram For Car Service App
- Er Diagram Of Vechicle Management System
- Colloboration Diagram For Vehicle Management System
- Vehicle Network Management
- Vehical Management System Er Diagram
- Vehicle Management System Er Diagram And Full Project
- Data Flow Diagram Of Automatic Car Parking System