Competitor Analysis
Competitor analysis is a first and obligatory step in elaboration the proper corporate marketing strategy and creating sustainable competitive advantage. Use powerful opportunities of numerous solutions from ConceptDraw Solution Park for designing illustrative diagrams, charts, matrices which are necessary for effective competitor analysis.Growth-Share Matrix Software
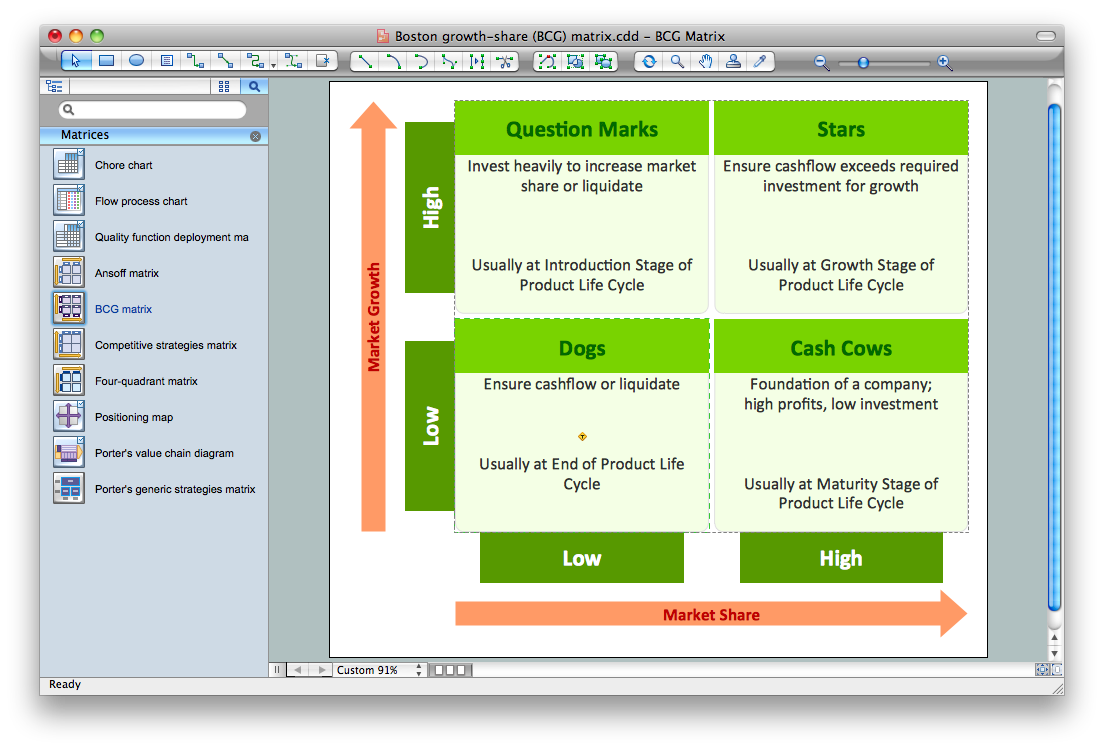
Growth-Share Matrix Software - ConceptDraw PRO is a powerful diagramming and vector drawing software for creating professional looking Growth–Share Matrices. For simple and quick creating the Growth–Share Matrix ConceptDraw PRO offers the Matrices Solution from the Marketing Area of ConceptDraw Solution Park. The Matrices Solution also provides a wide variety of templates and samples that will help you to create the Matrix diagrams of any difficulty.Business Tools Perceptual Mapping
This sample shows the Perceptual map. It was created in ConceptDraw PRO diagramming and vector drawing software using the Matrices Solution from the Marketing area of ConceptDraw Solution Park. Perception Mapping helps organizations measure and transform all aspects of their business, people and culture. Perception Mapping allows to represent the complex relationships graphically, helps identify potential problems of the organization and make the best decisions.Basketball Defense Drills
The Basketball solution for ConceptDraw PRO includes a wide collection of templates and samples to help you draw any basketball-related diagrams and schemas as quickly as possible. All templates are ready-to-modify. You can start from any of them, change positions, add vector clipart from the libraries, text and thus get ready diagram in some clicks.BPR Diagram. Business Process Reengineering Example
This sample was created in ConceptDraw PRO diagramming and vector drawing software using the Business Process Diagram Solution from the Business Processes area of ConceptDraw Solution Park. The Business Process Solution is based on the standard BPMN 2.0 and includes the set of libraries of ready-to-use objects.Defensive Formation – 4-3 Defense Diagram
Using diagrams is the easiest way to explain American Football defensive formations. The Football solution for ConceptDraw PRO contains a set of samples depicts the most popular defensive formations diagrams. Using embedded presentation tools you are able to share your football knowledge with wide audience.
 Matrices
This solution extends ConceptDraw PRO software with samples, templates and library of design elements for drawing the business matrix diagrams.
How to Prepare Learning Presentations for Training
Interactive tool helps you find the appropriate response to social media mentions quickly.Matrices
ConceptDraw PRO extended with Matrices Solution from the Marketing Area of ConceptDraw Solution Park is a powerful software for drawing various types of Marketing Matrices: Ansoff Matrix, BCG Matrix, Deployment Chart, Feature Comparison Chart, Competitive Strategies Matrix, Flow Process Chart, Porter's Value Chain Diagram, Positioning Map, and many others.House of Quality Matrix Software
House of Quality Matrix Software - Use the predesigned objects from the Involvement Matrix Objects Library from the Seven Management and Planning Tools Solution to create professional looking House of Quality Matrices in minutes.Pyramid Charts
ConceptDraw PRO extended with Pyramid Diagrams Solution from the Marketing Area of ConceptDraw Solution Park is a powerful Pyramid Charts making software. A Pyramid Chart has the form of triangle and hierarchically structures, organizes and help to analyze the information, data or ideas. Triangle is divided on the sections that usually have different widths. The width indicates the level of hierarchy among the topics.Pyramid Diagram
Pyramid diagrams help you visualize information as a triangle divided into horizontal slices. Labelled slices represent a hierarchy. Pyramids are used in marketing presentations to show and analyze hierarchy levels. 3D triangular diagram of DIKW pyramid has 6 levels: measurement, facts, data, information, knowledge, wisdom. The data component include different scattered signs or symbols which are merely useless until these random objective facts are somehow processed. Data is a resource which has to be manipulated or rearranged to get useful. Information can be extracted from a pile of data, it also can be mined from different data storages.HelpDesk
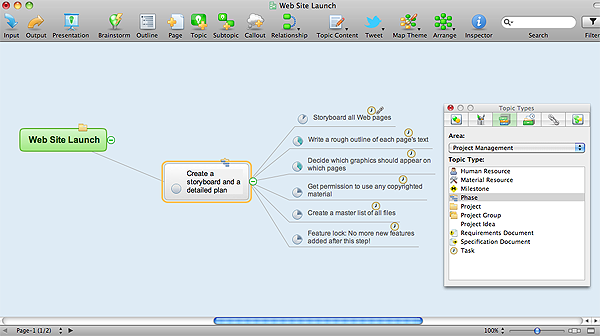
How to Create an Effective Mind Map Using Topic Types
Tips on how to increase mind map effectiveness using Topic Types functionality, delivered with ConceptDraw MINDMAP.
BCG Matrix
The growth–share matrix (BCG Matrix) was created by Bruce D. Henderson for the Boston Consulting Group in 1970 to help corporations to analyze their business units and to help the company allocate resources. How is it easy design the BCG Matrices in ConceptDraw PRO diagramming and vector drawing software supplied with unique Matrices Solution from the Marketing Area of ConceptDraw Solution Park.How to show a mind map presentation via Skype
Video tutorials on ConceptDraw products. Try it today!- Types Of Strategy Business
- Type Of Strategy
- Business Strategy Types
- Types Of Strategies
- Strategy Types
- Types Business Strategy
- Types Of Business Strategies
- Types Of Marketing Strategy
- SWOT Analysis Solution - Strategy Tools | Organizational Structure ...
- Strategy Types Business
- Types Of Business Strategy
- Competitive strategy matrix | Porter's generic strategies matrix ...
- Types Of Corporate Strategy With Examples
- Types Of Corporate Strategy
- Competitive strategy matrix
- Strategy Draw Tree Diagram
- Strategy Tree
- SWOT Analysis Solution - Strategy Tools | TOWS Matrix | TOWS ...
- Social strategy - Pyramid diagram | Pyramid Chart Examples ...


