Informative and Well-Designed Infographics
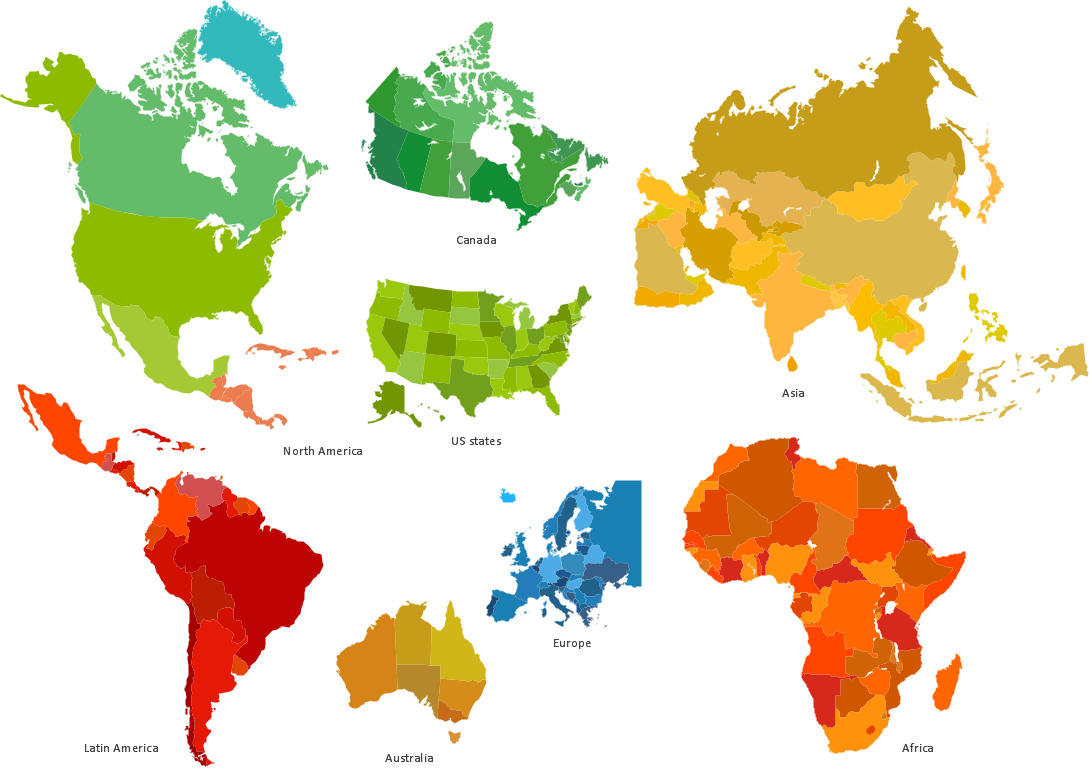
Informative and well-designed Infographics allows visually present various map containing information.
 Circle-Spoke Diagrams
Examples of subject areas that are well suited to this approach are marketing, business, products promotion, process modeling, market, resource, time, and cost analysis. Circle-Spoke Diagrams are successfully used in presentations, conferences, management documents, magazines, reportages, reviews, reports, TV, and social media.
Australia Map
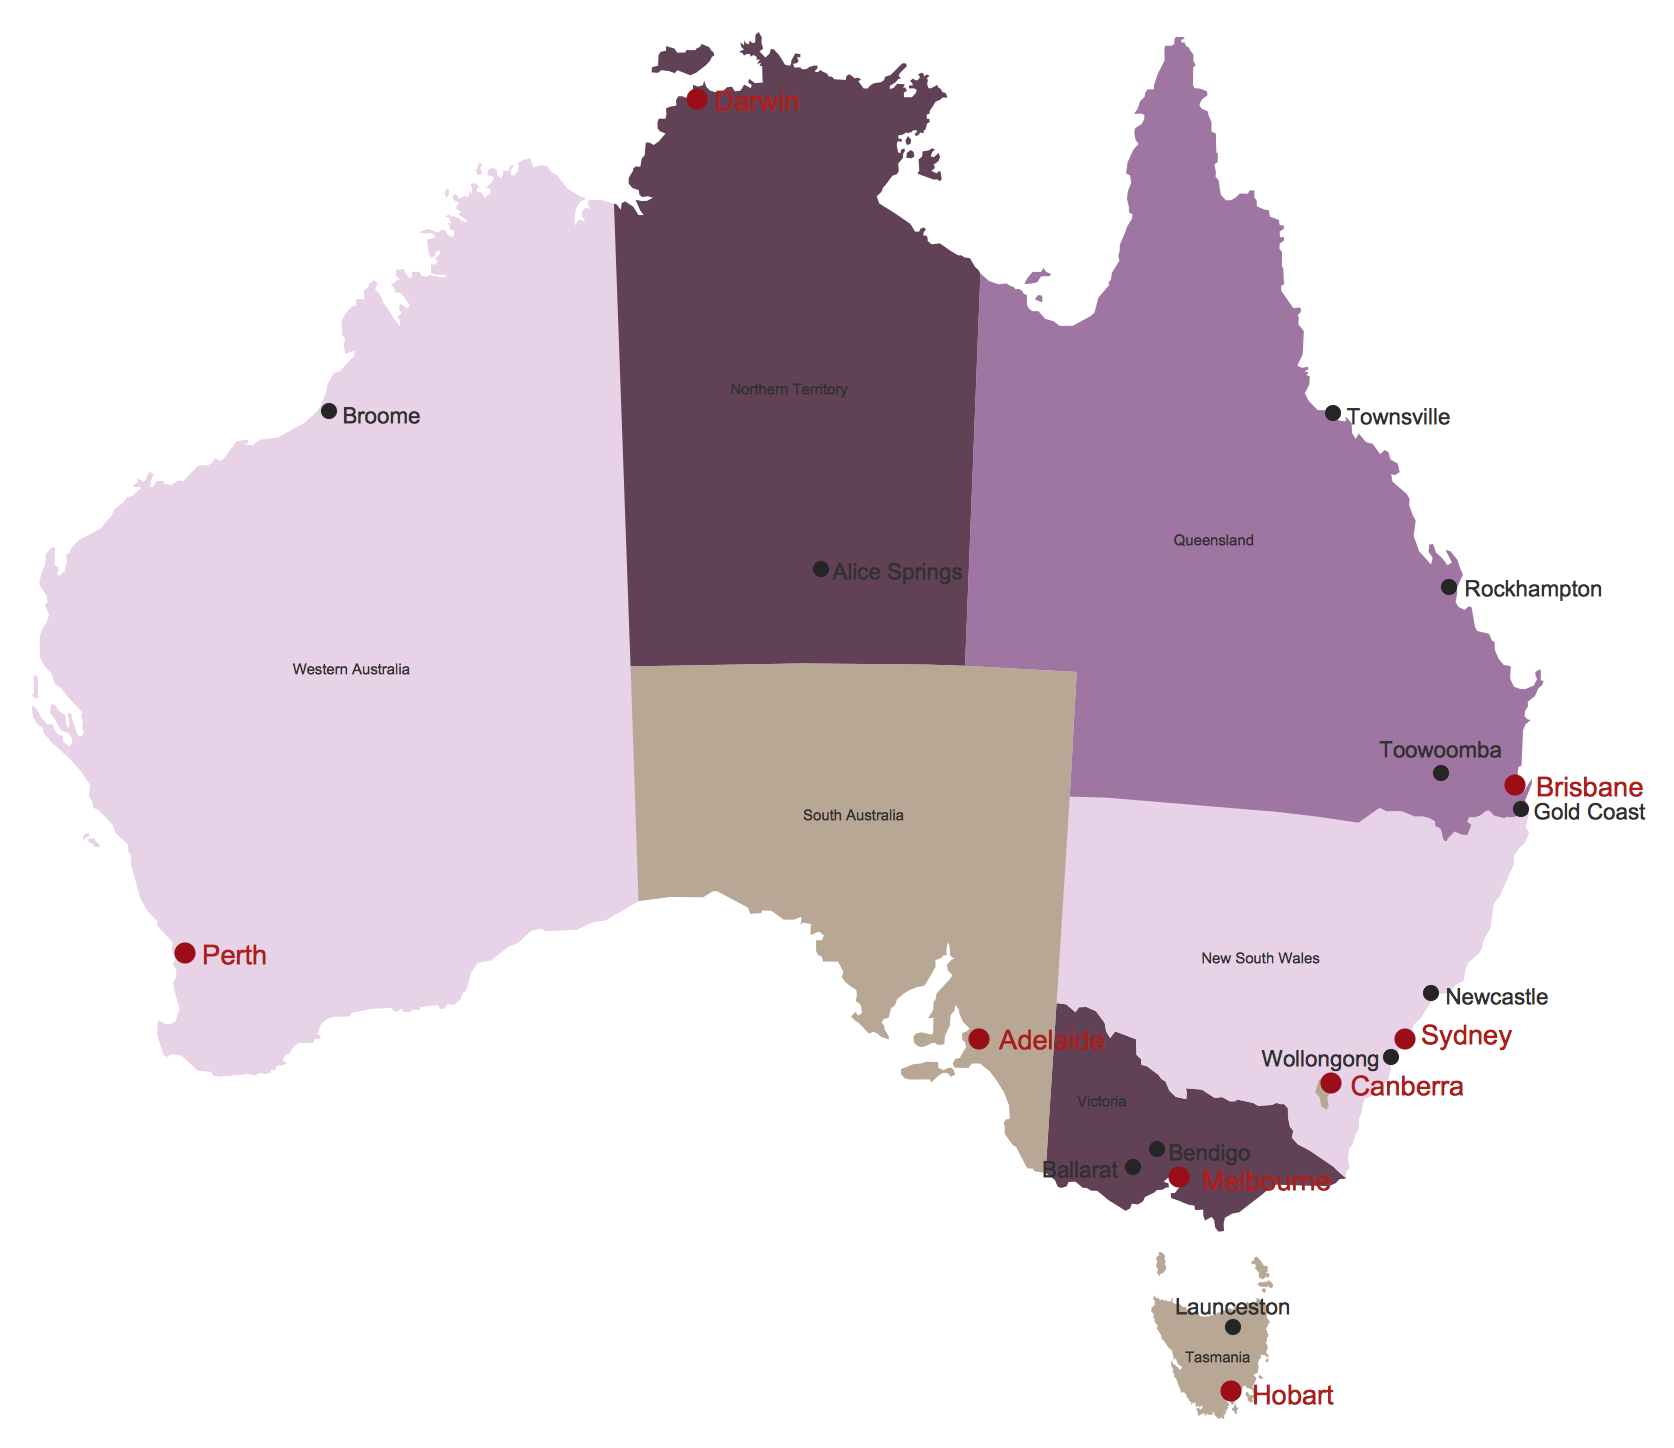
Maps surround us everywhere in our life, study, work, traveling, they are widely used in geography, history, politics, economics, and many other fields of science and life activity. But designing of maps is usually complex and labor-intensive process. Now we have the possibility to make easier this process - ConceptDraw PRO diagramming and vector drawing software extended with Australia Map Solution from the Maps Area of ConceptDraw Solution Park will help us in easy drawing detailed Australia map.AWS
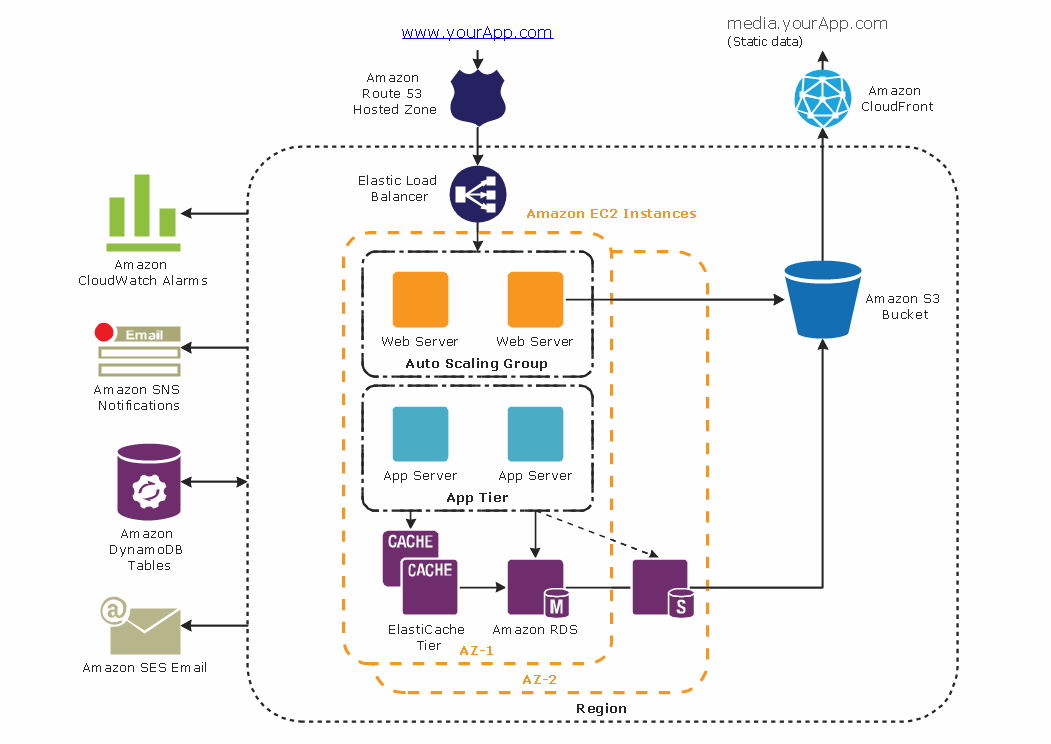
The AWS diagrams are convenient way for explaining the work of Amazon Web Services. ConceptDraw PRO diagramming and vector drawing software offers the AWS Architecture Diagrams Solution from the Computer and Networks Area for fast and easy creating the AWS diagrams of any complexity.
 UK Map
The Map of UK solution contains collection of professionally designed samples and scalable vector stencil graphics maps, representing the United Kingdom counties, regions and cities. Use the Map of UK solution from ConceptDraw Solution Park as the base fo
 USA Maps
Use the USA Maps solution to create a map of USA, a US interstate map, printable US maps, US maps with cities and US maps with capitals. Create a complete USA states map.
Draw Diagram on Mac
Professional diagramming software for mac helps you create Cause and Effect diagram known as Fishbone diagram or Ishikawa diagram from ConceptDraw Business Solution. You will be offered to use templates, samples or draw your diagram using ConceptDraw Arrows10 Technology
 Germany Map
The Germany Map solution contains collection of samples, templates and scalable vector stencil graphic maps, representing map of Germany and all 16 states of Germany. Use the Germany Map solution from ConceptDraw Solution Park as the base for various them
ConceptDraw Arrows10 Technology
How should diagramming software work? Is it possible to develop a diagram as quickly as the ideas come to you? The innovative ConceptDraw Smart Connectors Technology - This is more than enough versatility to draw any type of diagram with any degree of complexity. Connection points are necessary for diagramming network, flowchart and organizational charts. In ConceptDraw you connect shapes by attaching, or snapping and gluing, connectors to shape connection points.
 Spatial Dashboard
Spatial dashboard solution extends ConceptDraw PRO software with templates, samples and vector stencils libraries with thematic maps for drawing visual dashboards showing spatial data.
 Australia Map
For graphic artists creating accurate maps of Australia. The Australia Map solution - allows designers to map Australia for their needs, offers a collection of scalable graphics representing the political geography of Australia, split into distinct state
Competitor Analysis
Competitor analysis is a first and obligatory step in elaboration the proper corporate marketing strategy and creating sustainable competitive advantage. Use powerful opportunities of numerous solutions from ConceptDraw Solution Park for designing illustrative diagrams, charts, matrices which are necessary for effective competitor analysis.Best Tool for Infographic Construction
ConceptDraw is a best data visualization tool that will allow everyone to create rich infographics and visualizations quickly and easily.Export from ConceptDraw PRO Document to a Graphic File
Now it’s easy to share your visual documents with other people in a form most convenient for them. ConceptDraw PRO can save your drawings and diagrams in a number of highly useful formats, including graphic files. You can save your drawing as a .PNG, .JPG, or other graphic format file.
Area Network. Computer and Network Examples
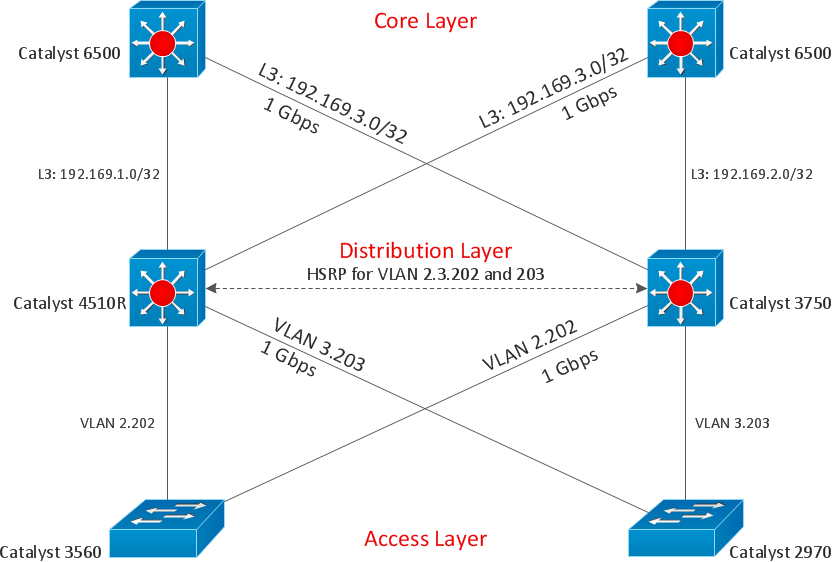
Computer and Networks Area contains several solutions that allows to create various types of diagrams: computer network architecture, topology, and design; logical, physical, cable networks; rack diagrams, Cisco networks, telecommunication network diagrams, wireless networks, etc.
- Concept Maps And Thematic Web Charts
- The most spoken languages of the world | Languages of South ...
- Business Report Pie. Pie Chart Examples | Examples of Flowcharts ...
- Examples of Flowcharts, Org Charts and More | Organization Chart ...
- Workflow Diagram Examples
- Classification Of Resources Explain By Web Chart
- Material Requisition Flowchart. Flowchart Examples | Examples of ...
- Examples of Flowcharts, Org Charts and More | IDEF0 standard with ...
- Types of Flowcharts | Examples of Flowcharts, Org Charts and More ...
- Examples of Flowcharts, Org Charts and More | Pyramid Diagram ...
- Examples of Flowcharts, Org Charts and More | Material Requisition ...
- Types of Flowchart - Overview | Examples of Flowcharts, Org Charts ...
- How to Draw an Organization Chart | Examples of Flowcharts, Org ...
- Networking Design For Bank Project Flow Chart Diagram
- Process Flowchart | Examples of Flowcharts, Org Charts and More ...
- Waterfall Bar Chart | Chart Examples | Examples of Flowcharts, Org ...
- Network Layout Floor Plans | Network Diagram Examples ...
- Sample Project Flowchart. Flowchart Examples | Flowchart ...
- Basic Flowchart Symbols and Meaning | Cross-Functional Flowchart ...
- Examples of Flowcharts, Org Charts and More | Process Flowchart ...
