"Causes in the diagram are often categorized, such as to the 6 M's ...
The 6 Ms (used in manufacturing industry):
(1) Machine (technology);
(2) Method (process);
(3) Material (Includes Raw Material, Consumables and Information.);
(4) Man Power (physical work)/ Mind Power (brain work): Kaizens, Suggestions;
(5) Measurement (Inspection);
(6) Milieu/ Mother Nature (Environment).
The original 6Ms used by the Toyota Production System have been expanded by some to include the following and are referred to as the 8Ms. However, this is not globally recognized. It has been suggested to return to the roots of the tools and to keep the teaching simple while recognizing the original intent; most programs do not address the 8Ms.
(7) Management/ Money Power;
(8) Maintenance." [Ishikawa diagram. Wikipedia]
This 8Ms Ishikawa diagram (manufacturing cause and effect diagram) template is included in the Fishbone Diagram solution from the Management area of ConceptDraw Solution Park.
8Ms Ishikawa diagram

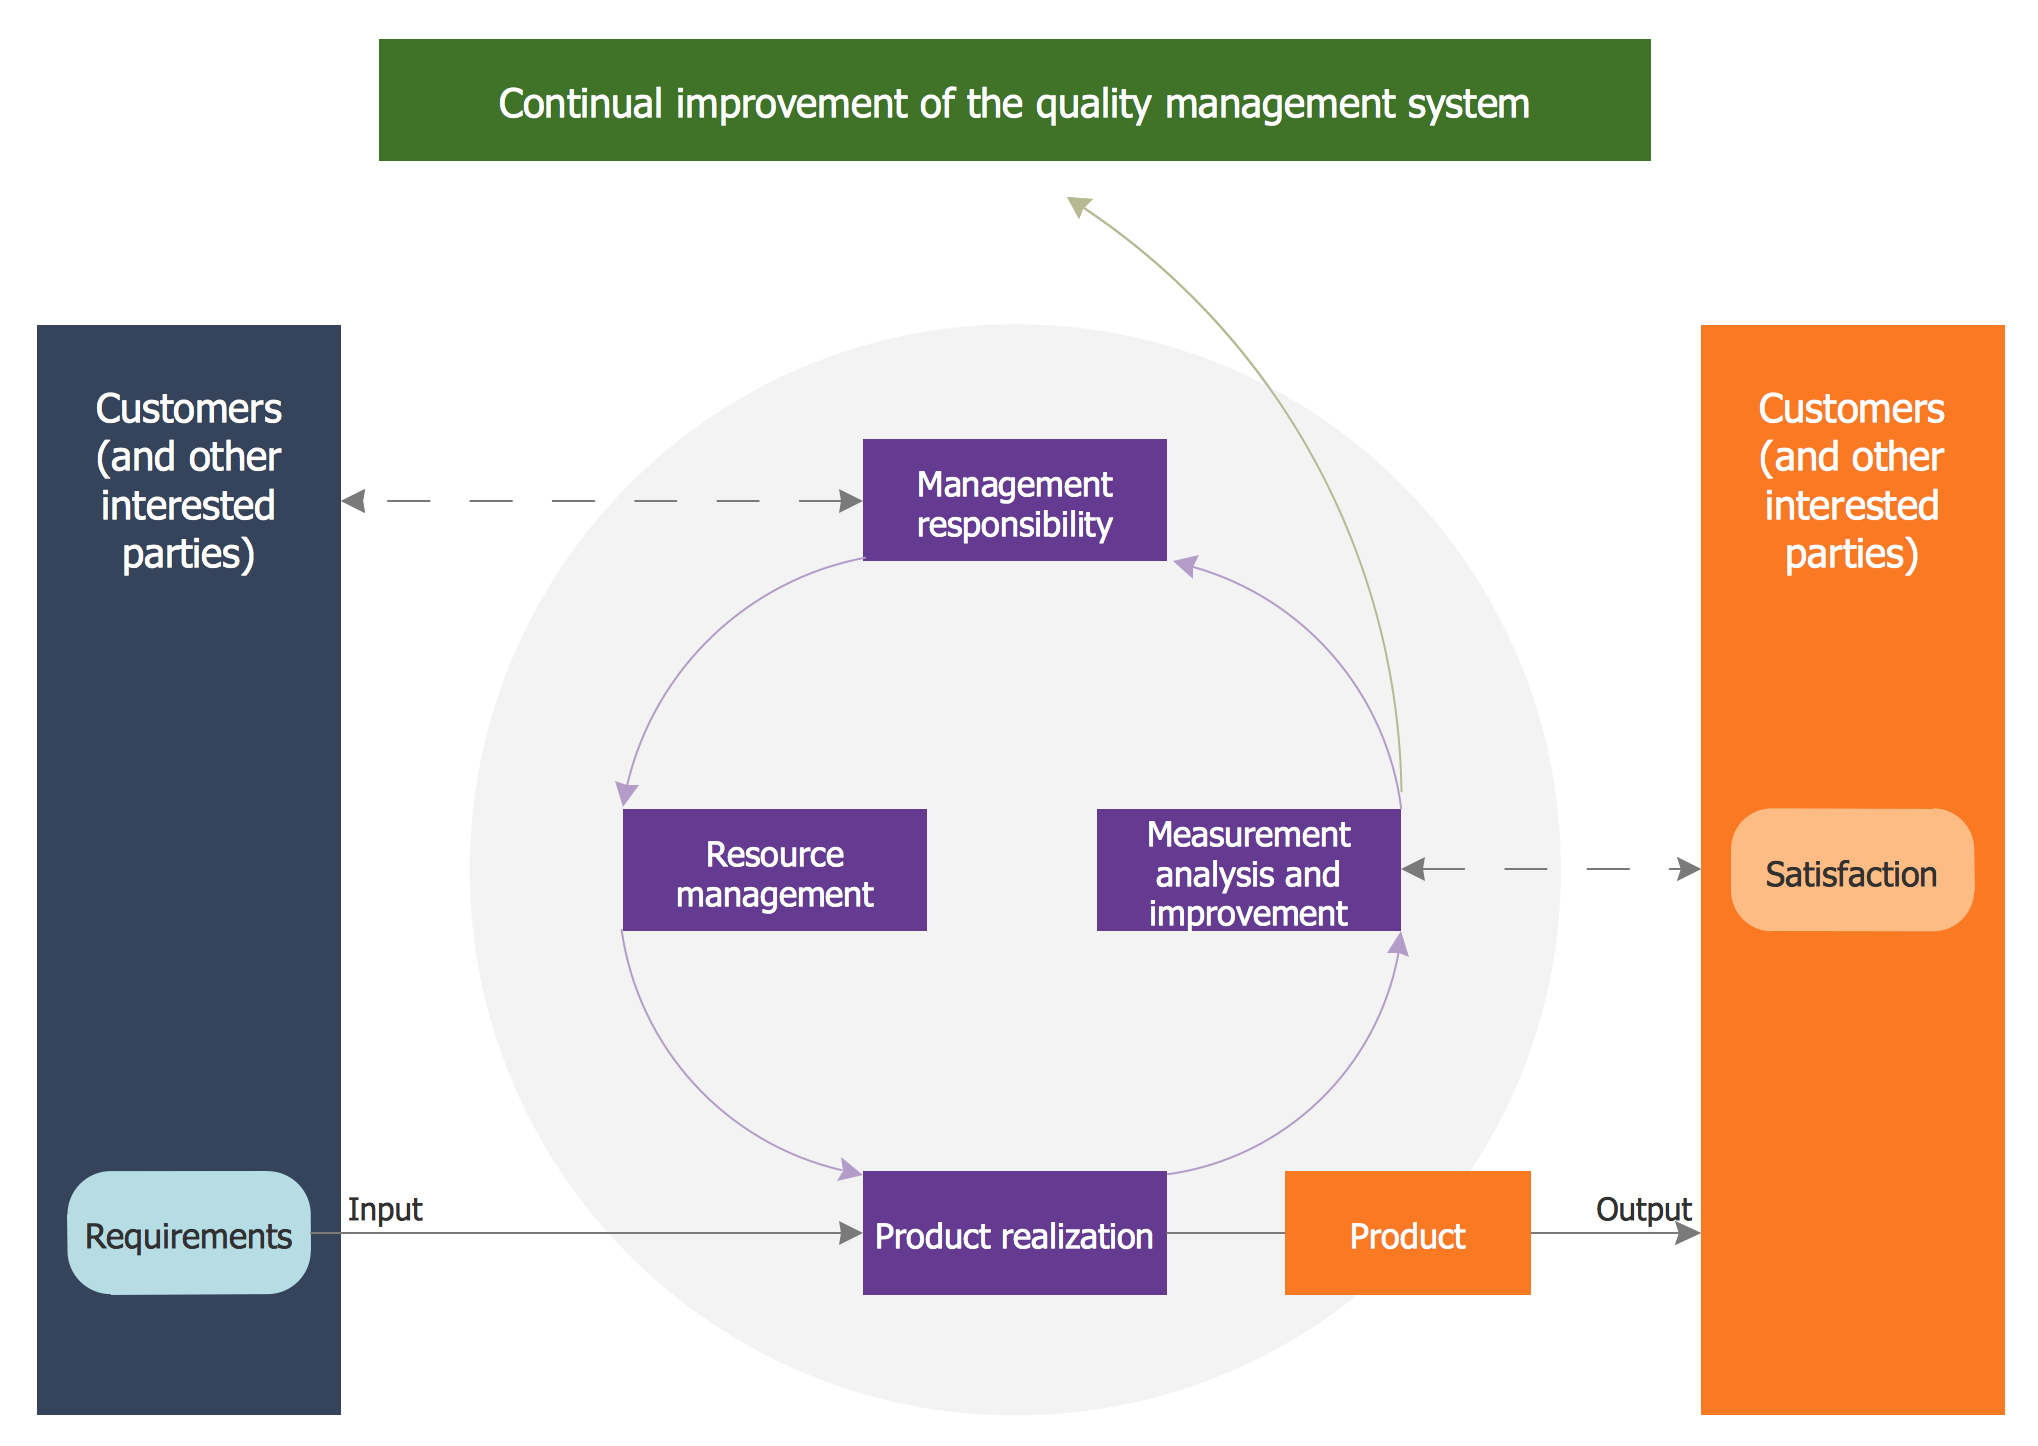
Total Quality Management Value

 Fishbone Diagram
Fishbone Diagrams solution extends ConceptDraw DIAGRAM software with templates, samples and library of vector stencils for drawing the Ishikawa diagrams for cause and effect analysis.
Total Quality Management with ConceptDraw

Management Tools — Total Quality Management

Organizational Structure Total Quality Management

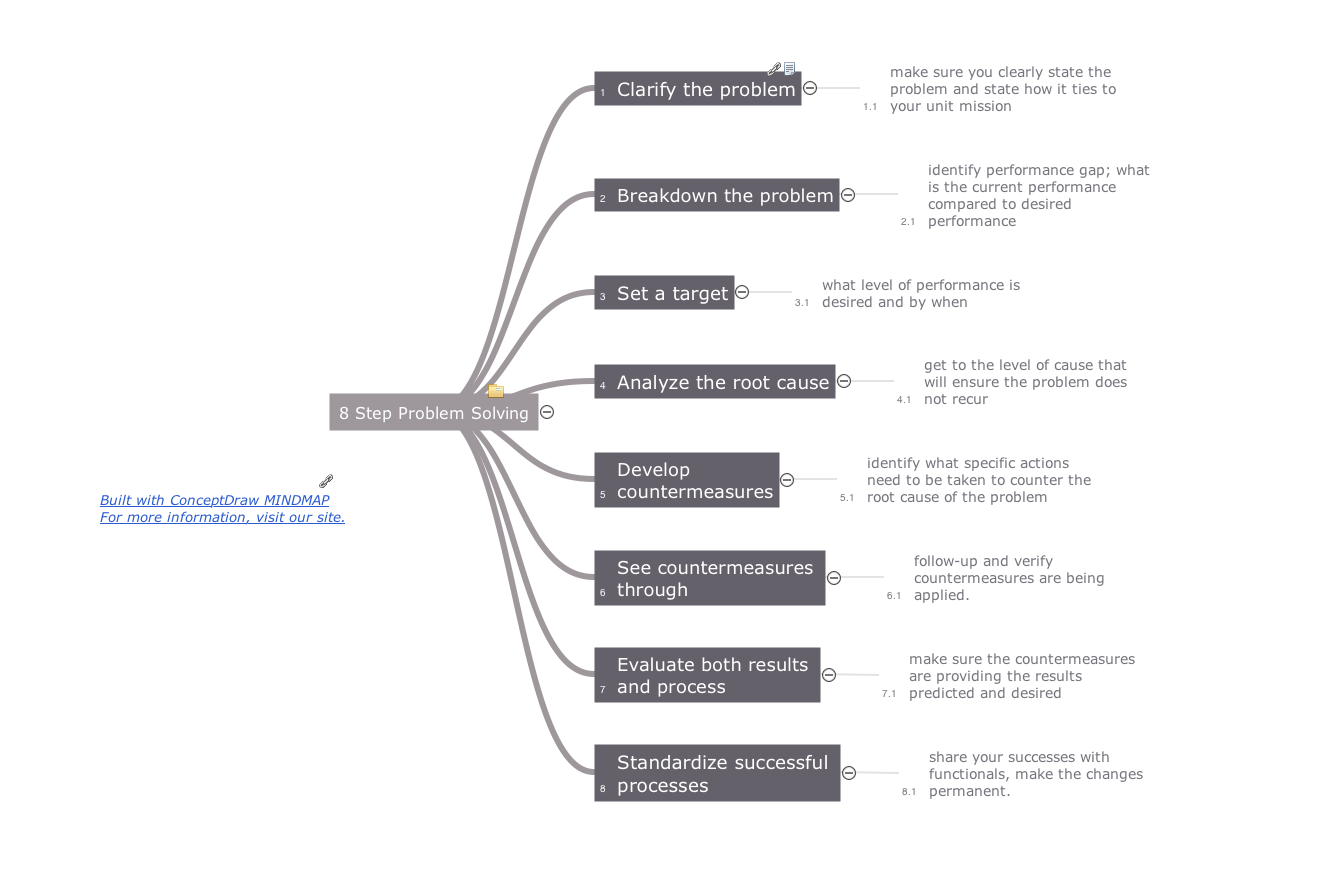
Using Fishbone Diagrams for Problem Solving

Quality Management System
Swim Lane Diagrams

Quality Improvement
TQM Diagram — Professional Total Quality Management

Quality Management Tools
-Diagram-in-SolutionBrowser.png)
Quality Management Teams
Managing the task list

- Fishbone diagram - Production process
- Total Quality Management Value | Manufacturing 8 Ms fishbone ...
- Fishbone diagram - Production process
- 4m Fishbone
- Manufacturing 8 Ms fishbone diagram - Template | Business ...
- Total Quality Management Value | Fishbone Diagram ...
- 4m Fishbone Diagram
- Total Quality Management Value | Manufacturing 8 Ms fishbone ...
- Total Quality Management Value | Manufacturing 8 Ms fishbone ...
- Manufacturing 8 Ms fishbone diagram - Template | Business ...
- Diagram Of Production Process
- Total Quality Management Value | Manufacturing 8 Ms fishbone ...
- Ishikawa Diagram | Total Quality Management Value | Using ...
- 4m Method
- 4m In Fishbone Diagram
- Manufacturing 8 Ms fishbone diagram - Template | Total Quality ...
- Production Management Diagram
- Total Quality Management Value | Manufacturing 8 Ms fishbone ...
- 4 M In Fishbone
- Total Quality Management Value | Manufacturing 8 Ms fishbone ...