The Data Flow Diagrams solution from the Software Development area of ConceptDraw Solution Park provides three vector stencils libraries for drawing DFD using the ConceptDraw PRO diagramming and vector drawing software . The design elements library "Data flow diagram (DFD)" contains 15 symbols for drawing both context-level data flow diagram and Level 1 DFD. The design elements library "DFD, Gane-Sarson notation contains 12 symbols of Gane-Sarson DFD notation. The design elements library "DFD, Yourdon and Coad notation contains 22 symbols of Yourdon/ DeMarco DFD notation.
Use these DFD symbol libraries to design the process-oriented models, data-oriented models, data flowcharts, data process diagrams, structured analysis diagrams, and information flow diagrams.
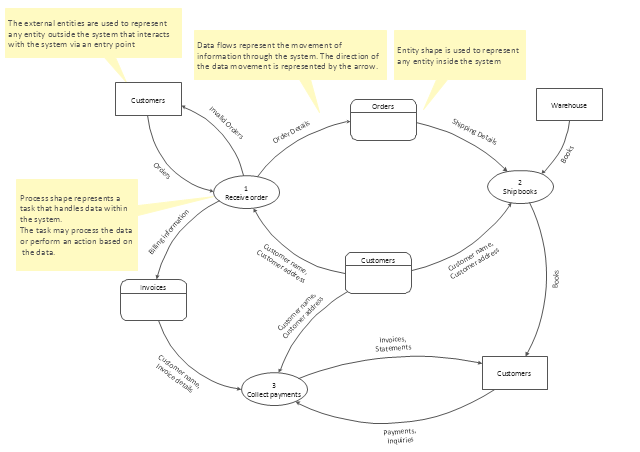
"A data flow diagram (DFD) is a graphical representation of the "flow" of data through an information system, modeling its process aspects. Often they are a preliminary step used to create an overview of the system which can later be elaborated. DFDs can also be used for the visualization of data processing (structured design).
A DFD shows what kinds of information will be input to and output from the system, where the data will come from and go to, and where the data will be stored. It does not show information about the timing of processes, or information about whether processes will operate in sequence or in parallel (which is shown on a flowchart)." [Data flow diagram. Wikipedia]
The example "Design elements - Data Flow Diagram (DFD)" is included in the Data Flow Diagrams solution.
Use these DFD symbol libraries to design the process-oriented models, data-oriented models, data flowcharts, data process diagrams, structured analysis diagrams, and information flow diagrams.
"A data flow diagram (DFD) is a graphical representation of the "flow" of data through an information system, modeling its process aspects. Often they are a preliminary step used to create an overview of the system which can later be elaborated. DFDs can also be used for the visualization of data processing (structured design).
A DFD shows what kinds of information will be input to and output from the system, where the data will come from and go to, and where the data will be stored. It does not show information about the timing of processes, or information about whether processes will operate in sequence or in parallel (which is shown on a flowchart)." [Data flow diagram. Wikipedia]
The example "Design elements - Data Flow Diagram (DFD)" is included in the Data Flow Diagrams solution.
DFD symbols
.png--diagram-flowchart-example.png)
Data Flow Diagrams (DFD) visualize data flows in information systems.
They show: what kinds of data input to and output from the system; where the data come from and go to; where the data is stored.
DFDs are used for design and analysis of business and engineering information systems.
They are also used for data processing visualization.
They show: what kinds of data input to and output from the system; where the data come from and go to; where the data is stored.
DFDs are used for design and analysis of business and engineering information systems.
They are also used for data processing visualization.
DFD template
Data structure diagram with ConceptDraw PRO

"A chart can take a large variety of forms, however there are common features that provide the chart with its ability to extract meaning from data.
Typically the data in a chart is represented graphically, since humans are generally able to infer meaning from pictures quicker than from text. Text is generally used only to annotate the data.
One of the more important uses of text in a graph is the title. A graph's title usually appears above the main graphic and provides a succinct description of what the data in the graph refers to.
Dimensions in the data are often displayed on axes. If a horizontal and a vertical axis are used, they are usually referred to as the x-axis and y-axis respectively. Each axis will have a scale, denoted by periodic graduations and usually accompanied by numerical or categorical indications. Each axis will typically also have a label displayed outside or beside it, briefly describing the dimension represented. If the scale is numerical, the label will often be suffixed with the unit of that scale in parentheses. ...
Within the graph a grid of lines may appear to aid in the visual alignment of data. The grid can be enhanced by visually emphasizing the lines at regular or significant graduations. The emphasized lines are then called major grid lines and the remainder are minor grid lines.
The data of a chart can appear in all manner of formats, and may include individual textual labels describing the datum associated with the indicated position in the chart. The data may appear as dots or shapes, connected or unconnected, and in any combination of colors and patterns. Inferences or points of interest can be overlaid directly on the graph to further aid information extraction.
When the data appearing in a chart contains multiple variables, the chart may include a legend (also known as a key). A legend contains a list of the variables appearing in the chart and an example of their appearance. This information allows the data from each variable to be identified in the chart." [Chart. Wikipedia]
The vector stencils library "Time series charts" contains 10 templates: 3 column charts, 3 bar charts, 2 line graphs and 2 dot plots. All these charts are Live Objects displaying the data from external data source files.
Use these chart templates to design your business performance digital dashboards using the ConceptDraw PRO diagramming and vector drawing software.
The example "Design elements - Time series charts" is included in the Time Series Dashboard solution from the area "What is a Dashboard" of ConceptDraw Solution Park.
Time series charts

Business Process Elements: Data
")

"Data flow diagrams are one of the three essential perspectives of the structured-systems analysis and design method SSADM. The sponsor of a project and the end users will need to be briefed and consulted throughout all stages of a system's evolution. With a data flow diagram, users are able to visualize how the system will operate, what the system will accomplish, and how the system will be implemented. The old system's dataflow diagrams can be drawn up and compared with the new system's data flow diagrams to draw comparisons to implement a more efficient system. Data flow diagrams can be used to provide the end user with a physical idea of where the data they input ultimately has an effect upon the structure of the whole system from order to dispatch to report. How any system is developed can be determined through a data flow diagram model.
In the course of developing a set of levelled data flow diagrams the analyst/ designers is forced to address how the system may be decomposed into component sub-systems, and to identify the transaction data in the data model.
Data flow diagrams can be used in both Analysis and Design phase of the SDLC.
There are different notations to draw data flow diagrams (Yourdon & Coad and Gane & Sarson), defining different visual representations for processes, data stores, data flow, and external entities." [Data flow diagram. Wikipedia]
The DFD (Yourdon and Coad notation) example "Process of account receivable" was created using the ConceptDraw PRO diagramming and vector drawing software extended with the Data Flow Diagrams solution from the Software Development area of ConceptDraw Solution Park.
Data Flow Diagram

The Data flow diagram (DFD) example "Payment for goods using UPS code scanner" shows data flow in process of payment for goods in the shop using the MaxiCode scanner.
"MaxiCode is a public domain, machine-readable symbol system originally created and used by United Parcel Service. Suitable for tracking and managing the shipment of packages, it resembles a barcode, but uses dots arranged in a hexagonal grid instead of bars. MaxiCode has been standardised under ISO/ IEC 16023.
A MaxiCode symbol (internally called "Bird's Eye", "Target", "dense code", or "UPS code") appears as a 1 inch square, with a bullseye in the middle, surrounded by a pattern of hexagonal dots. It can store about 93 characters of information, and up to 8 MaxiCode symbols can be chained together to convey more data. The centered symmetrical bullseye is useful in automatic symbol location regardless of orientation, and it allows MaxiCode symbols to be scanned even on a package traveling rapidly." [MaxiCode. Wikipedia]
This example of data flow diagram (Gane & Sarson notation) was created using the ConceptDraw PRO diagramming and vector drawing software extended with the Data Flow Diagrams solution from the Software Development area of ConceptDraw Solution Park.
DFD
---payment-for-goods-using-ups-code-scanner.png--diagram-flowchart-example.png)
 Data Flow Diagrams (DFD)
Data Flow Diagrams solution extends ConceptDraw PRO software with templates, samples and libraries of vector stencils for drawing the data flow diagrams (DFD).
Use this template to create your data flow diagrams (DFD) by Gane-Sarson (DFD) notation using the ConceptDraw PRO diagramming and vector drawing software extended with the Data Flow Diagrams solution from the Software Development area of ConceptDraw Solution Park.
DFD template
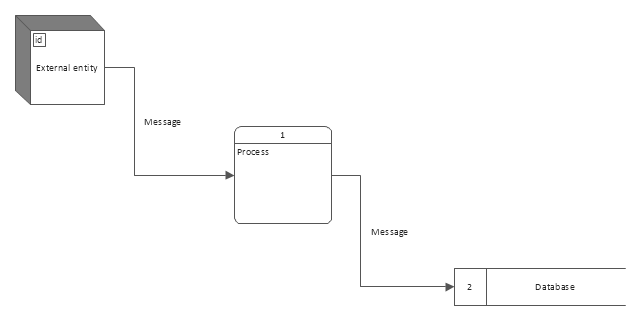
"A data flow diagram (DFD) is a graphical representation of the "flow" of data through an information system. It differs from the flowchart as it shows the data flow instead of the control flow of the program. A data flow diagram can also be used for the visualization of data processing (structured design). Data flow diagrams were invented by Larry Constantine, the original developer of structured design, based on Martin and Estrin's "data flow graph" model of computation.
It is common practice to draw a context-level Data flow diagram first which shows the interaction between the system and outside entities. The DFD is designed to show how a system is divided into smaller portions and to highlight the flow of data between those parts. This context-level Data flow diagram is then "exploded" to show more detail of the system being modeled" [Data model. Wikipedia]
The DFD (Yourdon and Coad notation) example "Model of small traditional production enterprise" was created using the ConceptDraw PRO diagramming and vector drawing software extended with the Data Flow Diagrams solution from the Software Development area of ConceptDraw Solution Park.
Data Flow Diagram Model

- Data Flow Diagrams
- Data flow diagram template
- Data Flow Diagrams
- Data flow diagram (DFD) example
- Data Flow Diagram (DFD)
- Data Flow Diagrams
- Data Flow Diagram Model | DFD - Model of small traditional ...
- Data Flow Diagram Process | DFD - Process of account receivable ...
- Design elements - Data Flow Diagram (DFD) | How to Create ...
- Data Flow Diagram (DFD)
- Data Flow Diagrams
- DFD Library - Design elements | DFD Library System | Data Flow ...
- Process Flowchart | Data Flow Diagrams | Flowchart Software |
- Data Flow Diagrams
- Data flow diagram (DFD)
- DFD Library System | Data Flow Diagrams | DFD Library - Design ...
- Data Flow Diagrams - Conceptdraw.com
- Data Flow Diagrams
- Data Flow Diagrams - Conceptdraw.com
- Data Flow Diagrams - Conceptdraw.com