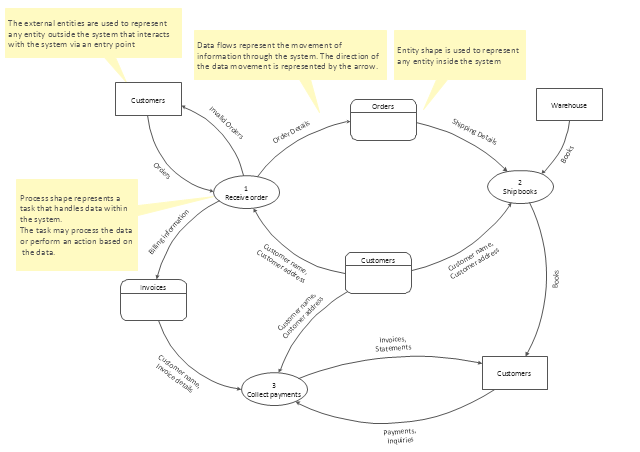
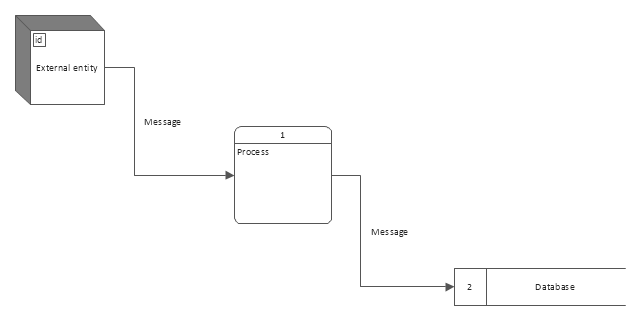
Data Flow Diagrams (DFD) visualize data flows in information systems.
They show: what kinds of data input to and output from the system; where the data come from and go to; where the data is stored.
DFDs are used for design and analysis of business and engineering information systems.
They are also used for data processing visualization.
They show: what kinds of data input to and output from the system; where the data come from and go to; where the data is stored.
DFDs are used for design and analysis of business and engineering information systems.
They are also used for data processing visualization.
DFD template
The Data flow diagram (DFD) example "Payment for goods using UPS code scanner" shows data flow in process of payment for goods in the shop using the MaxiCode scanner.
"MaxiCode is a public domain, machine-readable symbol system originally created and used by United Parcel Service. Suitable for tracking and managing the shipment of packages, it resembles a barcode, but uses dots arranged in a hexagonal grid instead of bars. MaxiCode has been standardised under ISO/ IEC 16023.
A MaxiCode symbol (internally called "Bird's Eye", "Target", "dense code", or "UPS code") appears as a 1 inch square, with a bullseye in the middle, surrounded by a pattern of hexagonal dots. It can store about 93 characters of information, and up to 8 MaxiCode symbols can be chained together to convey more data. The centered symmetrical bullseye is useful in automatic symbol location regardless of orientation, and it allows MaxiCode symbols to be scanned even on a package traveling rapidly." [MaxiCode. Wikipedia]
This example of data flow diagram (Gane & Sarson notation) was created using the ConceptDraw PRO diagramming and vector drawing software extended with the Data Flow Diagrams solution from the Software Development area of ConceptDraw Solution Park.
DFD
---payment-for-goods-using-ups-code-scanner.png--diagram-flowchart-example.png)
 Data Flow Diagrams (DFD)
Data Flow Diagrams solution extends ConceptDraw DIAGRAM software with templates, samples and libraries of vector stencils for drawing the data flow diagrams (DFD).
Data structure diagram with ConceptDraw DIAGRAM

 Universal Diagramming Area
This area collects solutions for drawing diagrams, charts, graphs, matrices, geographic and road maps for education, science, engineering, business.
Business diagrams & Org Charts with ConceptDraw DIAGRAM


ConceptDraw DIAGRAM DFD Software

Use this template to create your data flow diagrams (DFD) by Gane-Sarson (DFD) notation using the ConceptDraw PRO diagramming and vector drawing software extended with the Data Flow Diagrams solution from the Software Development area of ConceptDraw Solution Park.
DFD template
Garrett IA Diagrams with ConceptDraw DIAGRAM

Control and Information Architecture Diagrams (CIAD) with ConceptDraw DIAGRAM

Software development with ConceptDraw DIAGRAM

- Data Flow Diagrams
- Data Flow Diagrams
- Data flow diagram template
- Data Flow Diagrams with ConceptDraw PRO
- ConceptDraw PRO DFD Software | Data flow diagram (DFD ...
- Data flow diagram template | Software and Database Design with ...
- Data Flow Diagrams
- Data Flow Diagrams
- Data Flow Diagrams
- Data Flow Diagrams
- Data Flow Diagrams | Data Flow Diagrams with ConceptDraw PRO
- Data Flow Diagrams | ConceptDraw PRO The best Business ...
- Flowcharts | Cross-Functional Process Map Template | Data Flow ...
- Data Flow Diagrams | Cross-Functional Flowcharts
- Data Flow Diagrams with ConceptDraw PRO | Process Flowchart ...
- Data Flow Diagrams | Business diagrams & Org Charts with ...
- Structured Systems Analysis and Design Method (SSADM) with ...
- Business process Flow Chart - Event-Driven Process chain (EPC ...
- Diagram Flow Chart | Good Flow Chart app for Mac | Data Flow ...
- Data Flow Diagrams with ConceptDraw PRO | Interactive Voice ...