Business diagrams & Org Charts with ConceptDraw PRO


 Organizational Charts
Organizational Charts solution extends ConceptDraw PRO software with samples, templates and library of vector stencils for drawing the org charts.
HelpDesk
How to Add a Telecommunication Network Diagram to MS Word Document

HelpDesk
How To Convert a Telecommunication Network Diagram to Adobe PDF

HelpDesk
How to Add a Telecommunication Network Diagram to a PowerPoint Presentation

 25 Typical Orgcharts
The 25 Typical Orgcharts solution contains powerful organizational structure and organizational management drawing tools, a variety of professionally designed organization chart and matrix organization structure samples, 25 templates based on various orga
 ConceptDraw Solution Park
ConceptDraw Solution Park collects graphic extensions, examples and learning materials
"Telecommunication is communication at a distance by technological means, particularly through electrical signals or electromagnetic waves. ...
Electrical and electromagnetic telecommunication technologies include telegraph, telephone, and teleprinter, networks, radio, microwave transmission, fiber optics, communications satellites and the Internet." [Telecommunication. Wikipedia]
"A telecommunications service provider or TSP is a type of communications service provider that has traditionally provided telephone and similar services. This category includes incumbent local exchange carriers, competitive local exchange carriers, and mobile wireless communication companies. ...
While some people use the terms "telecom service provider" and "communications service provider" interchangeably, the term TSP generally excludes Internet service providers (ISPs), cable companies, satellite TV, and managed service providers. ...
TSPs provide access to telephone and related communications services." [Telecommunications service provider. Wikipedia]
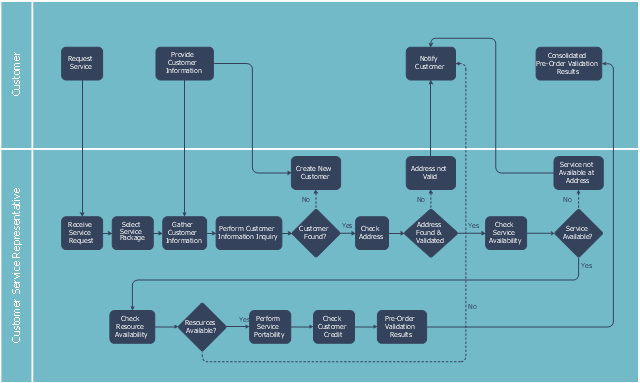
The cross-functional flowchart example "Providing telecom services" was created using the ConceptDraw PRO diagramming and vector drawing software extended with the Cross-Functional Flowcharts solution from the Business Processes area of ConceptDraw Solution Park.
Electrical and electromagnetic telecommunication technologies include telegraph, telephone, and teleprinter, networks, radio, microwave transmission, fiber optics, communications satellites and the Internet." [Telecommunication. Wikipedia]
"A telecommunications service provider or TSP is a type of communications service provider that has traditionally provided telephone and similar services. This category includes incumbent local exchange carriers, competitive local exchange carriers, and mobile wireless communication companies. ...
While some people use the terms "telecom service provider" and "communications service provider" interchangeably, the term TSP generally excludes Internet service providers (ISPs), cable companies, satellite TV, and managed service providers. ...
TSPs provide access to telephone and related communications services." [Telecommunications service provider. Wikipedia]
The cross-functional flowchart example "Providing telecom services" was created using the ConceptDraw PRO diagramming and vector drawing software extended with the Cross-Functional Flowcharts solution from the Business Processes area of ConceptDraw Solution Park.
Cross-functional flow chart
 Telecommunication Network Diagrams
Telecommunication Network Diagrams solution extends ConceptDraw PRO software with samples, templates, and great collection of vector stencils to help the specialists in a field of networks and telecommunications, as well as other users to create Computer systems networking and Telecommunication network diagrams for various fields, to organize the work of call centers, to design the GPRS networks and GPS navigational systems, mobile, satellite and hybrid communication networks, to construct the mobile TV networks and wireless broadband networks.
 Electric and Telecom Plans
This solution extends ConceptDraw PRO software with samples, templates and libraries of vector stencils for drawing the Electric and Telecom Plans.
Process Flowchart


Business Process Flowchart

 Cross-Functional Flowcharts
Cross-functional flowcharts are powerful and useful tool for visualizing and analyzing complex business processes which requires involvement of multiple people, teams or even departments. They let clearly represent a sequence of the process steps, the order of operations, relationships between processes and responsible functional units (such as departments or positions).
 Scatter Diagrams
The Scatter Diagrams solution extends ConceptDraw PRO v10 functionality with templates, samples, and a library of vector stencils that make construction of a Scatter Plot easy. The Scatter Chart Solution makes it easy to design attractive Scatter Diagrams used in various fields of science, work, and life activities. ConceptDraw PRO lets you enter the data to the table and construct the Scatter Plot Graph automatically according to these data.
 Management Area
The solutions from Management area of ConceptDraw Solution Park collect templates, samples and libraries of vector stencils for drawing the management diagrams and mind maps.
 Sales Dashboard
Sales Dashboard solution extends ConceptDraw PRO software with templates, samples and library of vector stencils for drawing the visual dashboards of sale metrics and key performance indicators (KPI).
 Cisco Network Diagrams
Cisco Network Diagrams solution extends ConceptDraw PRO with the best characteristics of network diagramming software. Included samples, templates and libraries of built-in standardized vector Cisco network icons and Cisco symbols of computers, network devices, network appliances and other Cisco network equipment will help network engineers, network designers, network and system administrators, as well as other IT professionals and corporate IT departments to diagram efficiently the network infrastructure, to visualize computer networks topologies, to design Cisco computer networks, and to create professional-looking Cisco Computer network diagrams, Cisco network designs and schematics, Network maps, and Network topology diagrams in minutes.
 Bubble Diagrams
Bubble diagrams have enjoyed great success in software engineering, architecture, economics, medicine, landscape design, scientific and educational process, for ideas organization during brainstorming, for making business illustrations, presentations, planning, design, and strategy development. They are popular because of their simplicity and their powerful visual communication attributes.
- Organizational Structure | ConceptDraw PRO - Organizational chart ...
- Business diagrams & Org Charts with ConceptDraw PRO | Cross ...
- Process Flowchart | Cross-functional flowchart - Providing telecom ...
- Business diagrams & Org Charts with ConceptDraw PRO
- Business diagrams & Org Charts with ConceptDraw PRO | Cross ...
- Organizational Structure Of Telecommunication Companies
- Organizational Structure | Example of Organizational Chart ...
- Telecommunication Network Chart
- Providing telecom services - Cross-functional flowchart | Process ...
- Organizational Structure | Process Flowchart | Flow chart Example ...
- A Flow Chart Of An Organisation
- Cross-Functional Flowcharts | Business diagrams & Org Charts with ...
- Business diagrams & Org Charts with ConceptDraw PRO | Process ...
- Www Draw 4 Telecom Com
- Examples of Flowcharts, Org Charts and More | How to Create a ...
- Network diagrams with ConceptDraw PRO | Computer Network ...
- Business diagrams & Org Charts with ConceptDraw PRO
- How to Draw an Organization Chart | Organizational Structure ...
- Computer Network Diagrams | Cisco Network Diagrams | Examples ...
- Business diagrams & Org Charts with ConceptDraw PRO | Business ...