This site uses cookies. By continuing to browse the ConceptDraw site you are agreeing to our Use of Site Cookies.

Mathematics Symbols

ConceptDraw PRO extended with Mathematics solution from the Science and Education area is a powerful diagramming and vector drawing software that offers all needed tools for mathematical diagrams designing.
Mathematics solution provides 3 libraries with predesigned vector mathematics symbols and figures:
Solid Geometry Library, Plane Geometry Library and Trigonometric Functions Library.

Mechanical Drawing Symbols

ConceptDraw PRO diagramming and vector drawing software extended with Mechanical Engineering solution from the Engineering area of ConceptDraw Solution Park provides a set of drawing tools and predesigned mechanical drawing symbols for fast and easy design various mechanical engineering diagrams, drawings and schematics.

Basic Flowchart Symbols and Meaning

Flowchart Symbols and Meaning - Provides a visual representation of basic flowchart symbols and their proposed use in professional workflow diagram, standard process flow diagram and communicating the structure of a well-developed web site, as well as their correlation in developing on-line instructional projects. See flowchart's symbols by specifics of process flow diagram symbols and workflow diagram symbols.
How to Build a Flowchart

ERD Symbols and Meanings

Crow's foot notation is used in Barker's Notation, Structured Systems Analysis and Design Method (SSADM) and information engineering. Crow's foot diagrams represent entities as boxes, and relationships as lines between the boxes. Different shapes at the ends of these lines represent the cardinality of the relationship.
The Chen's ERD notation is still used and is considered to present a more detailed way of representing entities and relationships.
To create an ERD, software engineers mainly turn to dedicated drawing software, which contain the full notation resources for their specific database design - ERD symbols and meanings. CS Odessa has released an all-inclusive Entity-Relationship Diagram (ERD) solution for their powerful drawing program, ConceptDraw PRO.
How to Build an Entity Relationship Diagram (ERD)

Basic Flowchart Images. Flowchart Examples

This sample was created in ConceptDraw PRO diagramming and vector drawing software using the Flowcharts solution from the Diagrams area of ConceptDraw Solution Park.
This sample shows the Flowchart that displays the procedures of 2PP (two-party preferred) voting and counting the voters. The two-party-preferred vote is the result of the elections that was distributed to the final two parties.
HelpDesk

How to Draw Geometric Shapes in ConceptDraw PRO

Knowledge of geometry grants people good logic, abstract and spatial thinking skills. The object of study of geometry are the size, shape and position, the 2-dimensional and 3-dimensional shapes. Geometry is related to many other areas in math, and is used daily by engineers, architects, designers and many other professionals. Today, the objects of geometry are not only shapes and solids. It deals with properties and relationships and looks much more about analysis and reasoning. Geometry drawings can be helpful when you study the geometry, or need to illustrate the some investigation related to geometry. ConceptDraw PRO allows you to draw plane and solid geometry shapes quickly and easily.
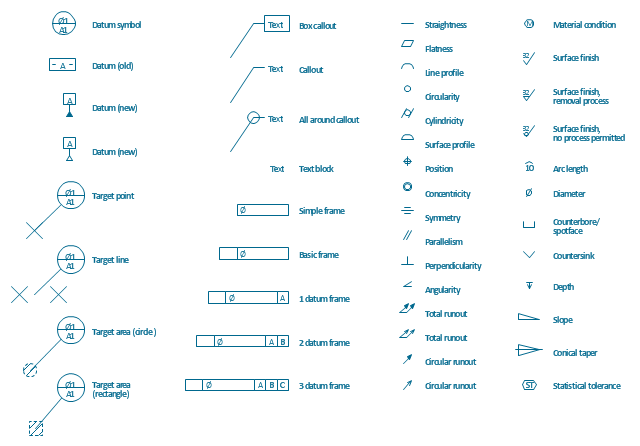
The vector stencils library "Dimensioning and tolerancing" contains 45 symbols of geometric dimensions and mechanical tolerances, geometric symbols, callouts, and text boxes and inserts.
Use these geometric dimensioning and tolerancing (GD&T) shapes to create annotated mechanical drawings.
"Geometric dimensioning and tolerancing (GD&T) is a system for defining and communicating engineering tolerances. It uses a symbolic language on engineering drawings and computer-generated three-dimensional solid models that explicitly describes nominal geometry and its allowable variation. It tells the manufacturing staff and machines what degree of accuracy and precision is needed on each controlled feature of the part. GD&T is used to define the nominal (theoretically perfect) geometry of parts and assemblies, to define the allowable variation in form and possible size of individual features, and to define the allowable variation between features." [Geometric dimensioning and tolerancing. Wikipedia]
The shapes example "Design elements - Dimensioning and tolerancing" was created using the ConceptDraw PRO diagramming and vector drawing software extended with the Mechanical Engineering solution from the ConceptDraw Solution Park.
Dimensioning and tolerancing symbols
Dimensioning and tolerancing symbols, total runout, text block, symmetry, surface, finish, roughness, surface profile, straightness, statistical tolerance, slope, position, positioning, perpendicularity, parallelism, material condition, line profile, flatness, diameter, depth, datum, reference, circle, datum, feature control, datum target, point, datum target, line, datum target, area, datum, cylindricity, countersink, counterbore, spotface, conical taper, concentricity, circularity, circular runout, callout, arc length, angularity,

Flowchart of Products. Flowchart Examples

This sample shows the Flowchart of the Sustainment and Disposal.
A Flowchart is a graphically representation of the process that step-by-step lead to the solution the problem. The geometric figures on the Flowchart represent the steps of the process and are connected with arrows that show the sequence of the actions. The Flowcharts are widely used in engineering, architecture, science, analytics, government, politics, business, marketing, manufacturing, administration, etc.

mathematical diagrams, mathematical symbols, tape diagrams Mathematics

mathematical diagrams, mathematical symbols, tape diagrams
Mathematics solution extends ConceptDraw PRO software with templates, samples and libraries of vector stencils for drawing the mathematical illustrations, diagrams and charts.

Sample Project Flowchart. Flowchart Examples

This sample shows the Flowchart that displays the architecture of SQL Exception Translation.
This sample was created in ConceptDraw PRO diagramming and vector drawing software using the Flowcharts solution from the Diagrams area of ConceptDraw Solution Park.
How to Simplify FlowCharting

Basic Diagramming

Perfect charts and graphics diagramming software with rich examples and template. ConceptDraw is ideal to draw Charts and Graphics.

Six Markets Model Chart

This sample shows the Six Markets Model Chart. It was created in ConceptDraw PRO diagramming and vector drawing software using the Marketing Diagrams Solution from the Marketing area of ConceptDraw Solution Park.
The six markets model defines six markets that take the central place in the relationship marketing: internal markets, supplier markets, recruitment markets, referral markets, influence markets and customer markets. The six markets model allows the organization to analyze the stakeholders and key market domains that can be important to it.

Flow Chart Creator

It is impossible to imagine the managing and analyzing of business and technical processes without flowcharts. They are the best way to visually represent the structural data, algorithms, the steps of the process, they allow to illustrate the process flow direction and solution to a given problem. ConceptDraw PRO diagramming and vector drawing software extended with flowchart maker and Flowcharts Solution from the "Diagrams" Area is a powerful Flow Chart Creator.

Vertical Cross Functional Flowchart

ConceptDraw PRO is a powerful tool that helps you create professional looking cross-functional flowcharts with the well-designed objects. ConceptDraw PRO - Drawing Software for Vertical Cross Functional Flowchart. ConceptDraw allows you to focus on work, not the drawing process. ConceptDraw Arrows10 Technology allows to draw connectors with smart behavior that gives flexibility to you during work process.

Example Process Flow

A flowchart is a picture of the separate steps of a process in sequential order.
ConceptDraw PRO is a Process Flowcharts software. This software includes basic package of process flow examples. The software contains object libraries with vector stencils that allows you use RapidDraw technology. By clicking on direction arrows you can add a new object to the flowchart.