HelpDesk
How to Create a Fault Tree Analysis Diagram (FTD) in ConceptDraw PRO

Fault tree analysis diagrams solution extends ConceptDraw PRO software with templates, samples and library of vector stencils for drawing the FTA diagrams.
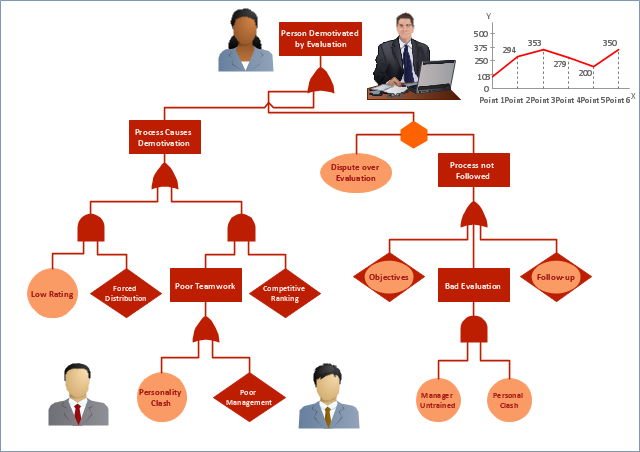
Fault Tree
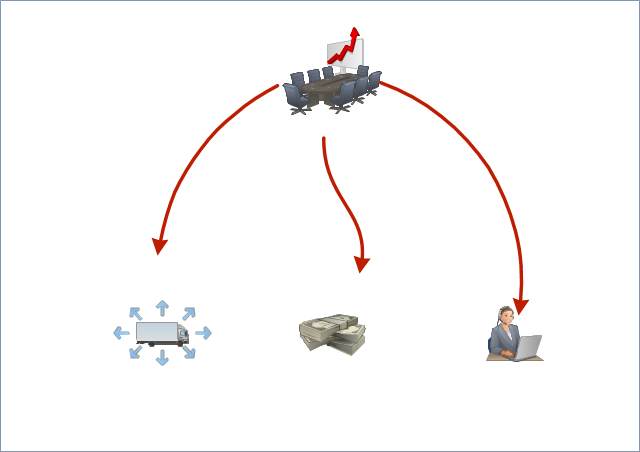
Workflow
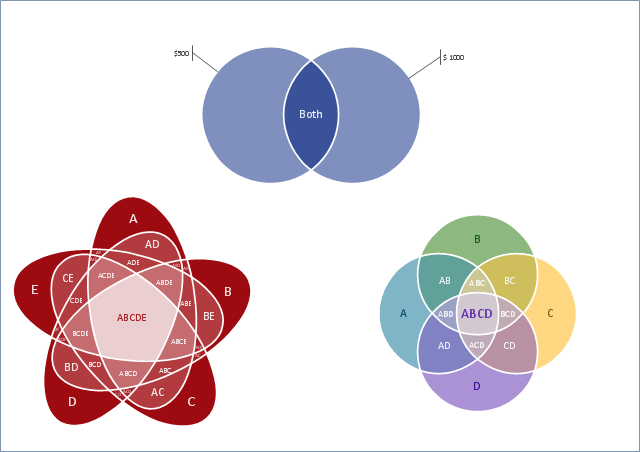
Cash Venn
Used Solutions
 Fault Tree Analysis Diagrams
This solution extends ConceptDraw PRO v9.5 or later with templates, fault tree analysis example, samples and a library of vector design elements for drawing FTA diagrams (or negative analytical trees), cause and effect diagrams and fault tree diagrams.
Fault Tree Diagram

HelpDesk
How to Draw a Decision-Making Diagram

The Best Flowchart Software Available


Management Tools — Total Quality Management

Process Flowchart


Fault Tree Analysis Software

Risk Diagram (Process Decision Program Chart)
")
- Mechanical Drawing Symbols | Mechanical Engineering | Chart ...
- Root cause analysis tree diagram - Template | Fault Tree Diagram ...
- Security and Access Plans | Tree Diagram In Digital Electronics
- Tree Diagram Of Became Electrical Engineer
- Communication medium diagram | Draw Tree Diagram Of ...
- Symbol Of Qc Tree Diagram
- Tree Diagram Of Solar System
- Electrical Engineering | Fault Tree Analysis Diagrams | Electrical ...
- Biology | Biology Symbols | Business Diagram Software | Tree Chart ...
- Astronomy | Physics Symbols | Stars And Planets Tree Diagram