Process Flow Diagram Symbols

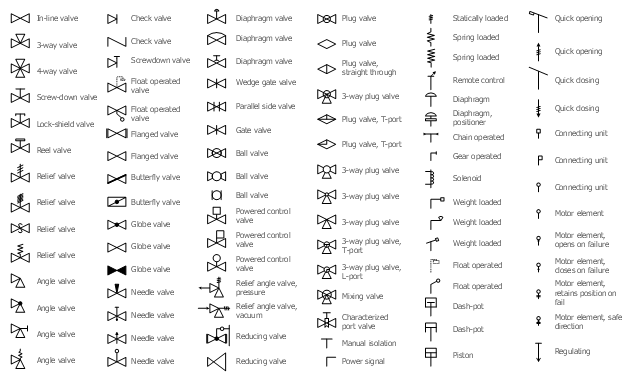
The vector stencils library "Valves" contains 91 symbols of piping and plumbing valves.
"A valve is a device that regulates, directs or controls the flow of a fluid (gases, liquids, fluidized solids, or slurries) by opening, closing, or partially obstructing various passageways. Valves are technically valves fittings, but are usually discussed as a separate category. In an open valve, fluid flows in a direction from higher pressure to lower pressure.
The simplest, and very ancient, valve is simply a freely hinged flap which drops to obstruct fluid (gas or liquid) flow in one direction, but is pushed open by flow in the opposite direction. This is called a check valve, as it prevents or "checks" the flow in one direction.
People in developed nations use valves in their daily lives, including plumbing valves, such as taps for tap water, gas control valves on cookers, small valves fitted to washing machines and dishwashers, safety devices fitted to hot water systems..." [Valve. Wikipedia]
Use the design elements library "Valves" to draw building plans, schematic diagrams, blueprints, or technical drawings of industrial piping systems; process, vacuum, and fluids piping; hydraulics piping; air and gas piping; materials distribution; and liquid transfer systems using the ConceptDraw PRO diagramming and vector drawing software.
The shapes library "Valves" is included in the Plumbing and Piping Plans solution from the Building Plans area of ConceptDraw Solution Park.
Valve symbols
F&B

Chemical Engineering

Types of Flowchart - Overview


Data Flow Diagram Examples

Value Stream Mapping - Design Elements

Piping and Instrumentation Diagram Software

Process Flow Diagrams

Design Pictorial Infographics. Design Infographics

- Cooker Control Unit Symbol
- Cooker Control Unit Symbol Bs3939
- Wiring Diagram And Symbol Of Cooker Control Unit
- Bs 3939 Symbol Of Cooker Unit
- Cooker Unit Circut Symbol
- Symbol Of Cooker Control Circuit
- Symbol Of Electric Cooker Unit In Bs3939
- Symbol Of A Cooker Circuit
- Cooker Unit Electrical Symbol
- Symbol Of Cooker Unit