This SWOT matrix diagram example was created on the base of article "An Easy Way To Jumpstart Your Strategic Plan: SWOT" by Leslie Wolf from the website of the California Digital Library, the University of California. "Strategic planning doesn’t have to be a daunting and lengthy process. The goal is really a simple one: to help you understand your world and build a road map to guide your efforts. ...
This analysis tool can help you focus your attention on the specific success factors that are right for your team.
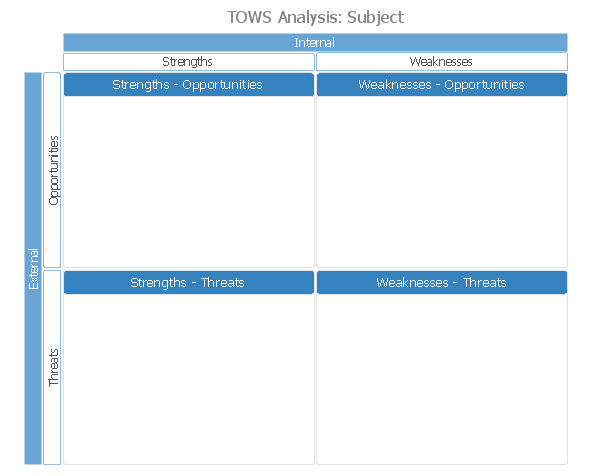
The tool is called a SWOT analysis. SWOT stands for Strengths and Weaknesses, Opportunities and Threats. Here’s what it means:
(1) Strengths are those positive internal attributes that strengthen your business or team. You can develop plans to capitalize on those strengths.
(2) Weaknesses are those negative internal attributes that are working against your success. You can shore up those weaknesses so they don’t stop your success.
(3) Opportunities are those external conditions that can have a positive effect on your goals. These opportunities can point you in the right direction.
(4) Threats are those external conditions that can have a negative effect on your goals. These threats will affect you less if you can identify and minimize them. ...
We thought it would be helpful to show you a sample SWOT analysis for a business you can easily visualize: a small independent bookstore in a university town. The store owner brought the team together to think about how the bookstore could survive during the continuing financial downturn. After an hour of brainstorming, this is the SWOT analysis they developed." [cdlib.org/ cdlinfo/ 2010/ 09/ 29/ an-easy-way-to-jumpstart-your-strategic-plan-swot/ ]
The matrix diagram example "SWOT analysis for a small independent bookstore" was created using the ConceptDraw PRO diagramming and vector drawing software extended with the SWOT Analysis solution from the Management area of ConceptDraw Solution Park.
This analysis tool can help you focus your attention on the specific success factors that are right for your team.
The tool is called a SWOT analysis. SWOT stands for Strengths and Weaknesses, Opportunities and Threats. Here’s what it means:
(1) Strengths are those positive internal attributes that strengthen your business or team. You can develop plans to capitalize on those strengths.
(2) Weaknesses are those negative internal attributes that are working against your success. You can shore up those weaknesses so they don’t stop your success.
(3) Opportunities are those external conditions that can have a positive effect on your goals. These opportunities can point you in the right direction.
(4) Threats are those external conditions that can have a negative effect on your goals. These threats will affect you less if you can identify and minimize them. ...
We thought it would be helpful to show you a sample SWOT analysis for a business you can easily visualize: a small independent bookstore in a university town. The store owner brought the team together to think about how the bookstore could survive during the continuing financial downturn. After an hour of brainstorming, this is the SWOT analysis they developed." [cdlib.org/ cdlinfo/ 2010/ 09/ 29/ an-easy-way-to-jumpstart-your-strategic-plan-swot/ ]
The matrix diagram example "SWOT analysis for a small independent bookstore" was created using the ConceptDraw PRO diagramming and vector drawing software extended with the SWOT Analysis solution from the Management area of ConceptDraw Solution Park.
SWOT matrix

Competitor Analysis

TOWS Analysis Software
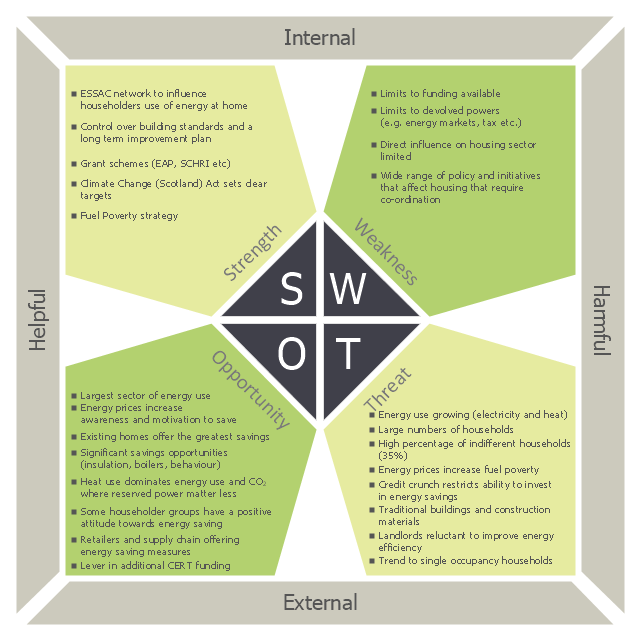
This sample was created on the base of the SWOT matrix illustrating the webpage "SWOT Analysis" of "Scottish Energy Study Volume 4: Issues, Opportunities and Barriers" from the website of the Scottish Government. [scotland.gov.uk/ Publications/ 2009/ 09/ 24094712/ 6]
The diagram example "Domestic sector SWOT" was created using the ConceptDraw PRO diagramming and vector drawing software extended with the SWOT Analysis solution from the Management area of ConceptDraw Solution Park.
The diagram example "Domestic sector SWOT" was created using the ConceptDraw PRO diagramming and vector drawing software extended with the SWOT Analysis solution from the Management area of ConceptDraw Solution Park.
SWOT matrix
ConceptDraw MINDMAP : Brainstorming, Mind Mapping for macOS and Windows

Cause and Effect Analysis - Fishbone Diagrams for Problem Solving

IDEF1 standard

Biology Drawing

Total Quality Management with ConceptDraw

How to Draw a Good Diagram of a Business Workflow?

ConceptDraw PROJECT Software Overview

Planogram Software and Retail Plan Software

Orgchart

How to show a mind map presentation via Skype
- SWOT Analysis | SWOT analysis for a small independent bookstore ...
- SWOT Analysis | Swot Analysis Examples | SWOT Sample in ...
- SWOT Analysis | Human Resource Development | SWOT and TOWS ...
- SWOT Analysis | SWOT Template | TOWS Matrix | Example Of Tows ...
- SWOT Analysis Solution - Strategy Tools | TOWS Matrix | TOWS ...
- SWOT analysis for a small independent bookstore | Accounting ...
- SWOT Analysis Solution - Strategy Tools | TOWS analysis matrix ...
- TOWS Analysis Software | TOWS Matrix | SWOT Analysis Solution ...
- SWOT Analysis | Mind Maps for Business - SWOT Analysis | How to ...
- SWOT Analysis | SWOT Matrix Software | SWOT Matrix | Hr Swot ...
- Swot Analysis For Construction Company Example
- SWOT Template | TOWS Analysis | TOWS Analysis Software | Swot ...
- SWOT Analysis | Create a Basic Presentation Quickly | SWOT and ...
- SWOT Analysis | SWOT Matrix | TOWS Analysis | Picture Of Swot ...
- SWOT Analysis | TOWS Matrix | Competitor Analysis | Weaknesses ...
- SWOT Matrix | SWOT analysis for a small independent bookstore ...
- Competitor Analysis | SWOT Analysis | SWOT Analysis Solution ...
- TOWS Matrix | TOWS analysis matrix - Template | SWOT analysis ...
- TOWS Analysis | TOWS Analysis Software | Electric Visual | Swot ...
- TOWS analysis matrix - Template | SWOT Analysis | TOWS Matrix ...