 Logistics Flow Charts
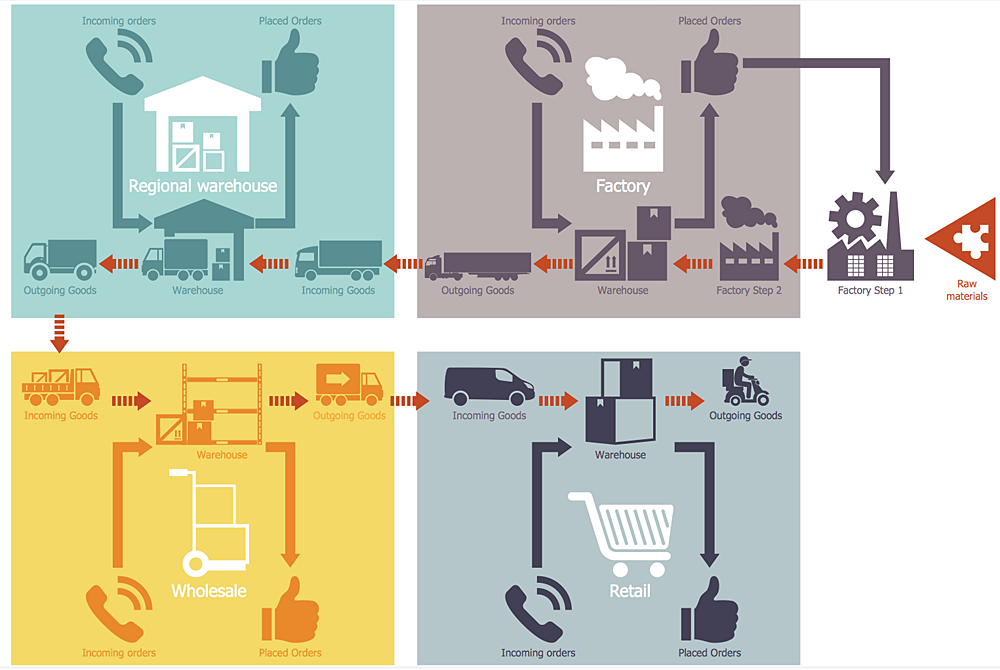
Logistics Flow Charts solution extends ConceptDraw PRO v11 functionality with opportunities of powerful logistics management software. It provides large collection of predesigned vector logistic symbols, pictograms, objects and clipart to help you design with pleasure Logistics flow chart, Logistics process flow diagram, Inventory flow chart, Warehouse flowchart, Warehouse management flow chart, Inventory control flowchart, or any other Logistics diagram. Use this solution for logistics planning, to reflect logistics activities and processes of an enterprise or firm, to depict the company's supply chains, to demonstrate the ways of enhancing the economic stability on the market, to realize logistics reforms and effective products' promotion.
Process Flowchart
The main reason of using Process Flowchart or PFD is to show relations between major parts of the system. Process Flowcharts are used in process engineering and chemical industry where there is a requirement of depicting relationships between major components only and not include minor parts. Process Flowcharts for single unit or multiple units differ in their structure and implementation. ConceptDraw PRO is Professional business process mapping software for making Process flowcharts, Process flow diagram, Workflow diagram, flowcharts and technical illustrations for business documents and also comprehensive visio for mac application. Easier define and document basic work and data flows, financial, production and quality management processes to increase efficiency of your business with ConcepDraw PRO. Business process mapping software with Flowchart Maker ConceptDraw PRO includes extensive drawing tools, rich examples and templates, process flowchart symbols and shape libraries, smart connectors that allow you create the flowcharts of complex processes, process flow diagrams, procedures and information exchange. Process Flowchart Solution is project management workflow tools which is part ConceptDraw Project marketing project management software. Drawing charts, diagrams, and network layouts has long been the monopoly of Microsoft Visio, making Mac users to struggle when needing such visio alternative like visio for mac, it requires only to view features, make a minor edit to, or print a diagram or chart. Thankfully to MS Visio alternative like ConceptDraw PRO software, this is cross-platform charting and business process management tool, now visio alternative for making sort of visio diagram is not a problem anymore however many people still name it business process visio tools.
Total Quality Management Definition
The Total Quality Management Diagram solution helps you and your organization visualize business and industrial processes. Create Total Quality Management diagrams for business process with ConceptDraw software.HelpDesk
How to Make a Logistics Flow Chart
ConceptDraw Logistics Flow Charts solution is a tool for designing Logistics Flow Charts, Diagram and related infographics. You can create variety of logistics visualizations: Logistics flow chart, Inventory flow chart, Warehouse flowchart, Logistics process flow diagram, Warehouse management flow chart, Inventory control flowchart, or any other Logistics diagram for your business and effectively use them to promote the goods and services, and to enhance the economic stability of your business.Types of Flowcharts
A Flowchart is a graphical representation of process, algorithm, workflow or step-by-step solution of the problem. It shows the steps as boxes of various kinds and connects them by arrows in a defined order depicting a flow. There are twelve main Flowchart types: Basic Flowchart, Business Process Modeling Diagram (BPMN), Cross Functional Flowchart, Data Flow Diagram (DFD), IDEF (Integrated DEFinition) Flowchart, Event-driven Process Chain (EPC) Diagram, Influence Diagram (ID), Swimlane Flowchart, Process Flow Diagram (PFD), Specification and Description Language (SDL) Diagram, Value Stream Mapping, Workflow Diagram. Using the Flowcharts solution from the Diagrams area of ConceptDraw Solution Park you can easy and quickly design a Flowchart of any of these types. This solution offers a lot of special predesigned vector symbols for each of these widely used notations. They will make the drawing process of Flowcharts much easier than ever. Pay also attention for the included collection of ready Flowchart examples, samples and quick-start templates. This is business process improvement tools. If you are looking for MS Visio for your Mac, then you are out of luck, because it hasn't been released yet. However, you can use Visio alternatives that can successfully replace its functions. ConceptDraw PRO is an alternative to MS Visio for Mac that provides powerful features and intuitive user interface for the same.
Cross-Functional Flowchart
Use of Cross-Functional Flowchart is a clear way of showing each team member’s responsibilities and how processes get shared or transferred between different responsible people, teams and departments. Use the best flowchart maker ConceptDraw PRO with a range of standardized cross-functional flowchart symbols to create the Cross-Functional Flowcharts simply and to visualize the relationship between a business process and the functional units responsible for that process. To draw the most quickly Cross-Functional Flowcharts, Cross Functional Process Maps, or Cross Functional Process Flow Diagrams, start with a Cross-functional flowchart samples and templates from ConceptDraw Solution Park. The ConceptDraw Arrows10 and RapidDraw technologies will be also useful for you in drawing. ConceptDraw PRO supports designing both types - horizontal and vertical Cross-functional flowcharts. A vertical layout makes the accents mainly on the functional units while a horizontal layout - on the process. If you need a Visio alternative in Mac OS X, try ConceptDraw PRO. Its interface is very intuitive and it’s actually much easier to use than Visio, yet somehow it’s just as powerful if not more so. ConceptDraw PRO performs professional quality work and seamless Visio interaction.
 Logistic Dashboard
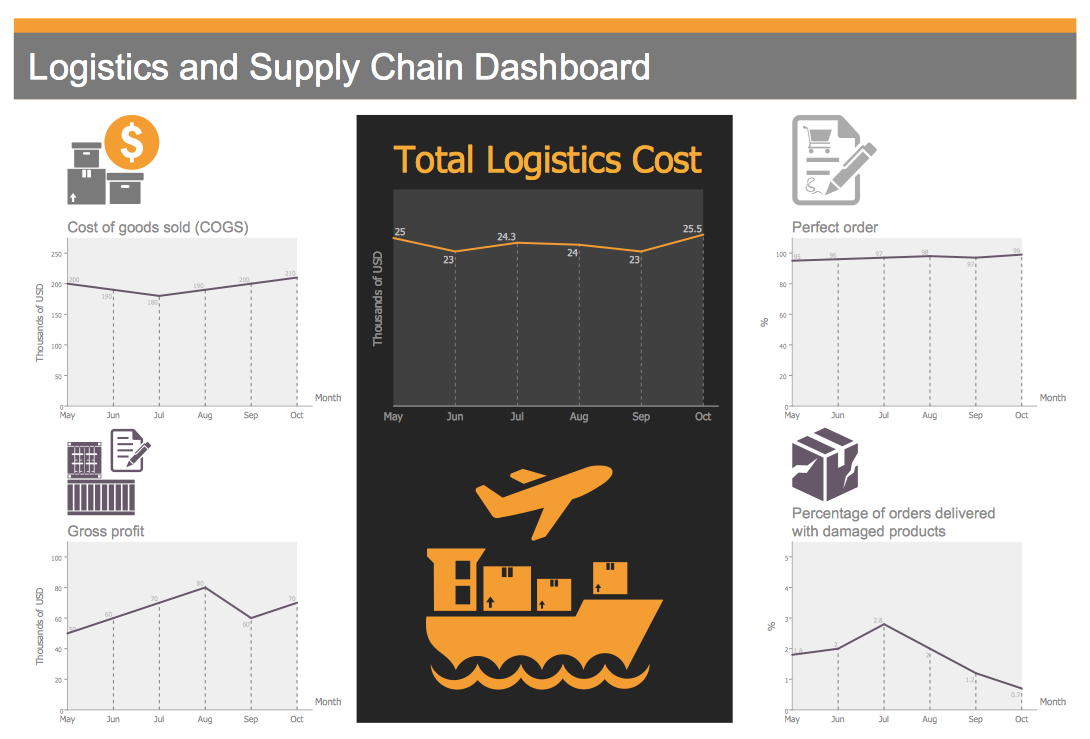
The powerful tools of Logistic Dashboard solution and specially developed live graphic objects of logistic icons, logistic navigation elements, logistic indicators, logistic charts and logistic maps effectively assist in designing Logistic dashboards, Logistic maps, Logistic charts, diagrams and infographics. The included set of prebuilt samples and quick-start templates, demonstrates the power of ConceptDraw PRO software in logistics management, its assisting abilities in development, realization and analyzing the logistic processes, as well as in perfection the methods of logistics management.
Flowchart Marketing Process. Flowchart Examples
This sample shows the Flowchart that displays the layout and work flow of the cloud marketing platform. This diagram has a style of the marketing brochure. This style displays the central product that is related to the other issues. Using the ready-to-use predesigned objects, samples and templates from the Flowcharts Solution for ConceptDraw PRO you can create your own professional looking Flowchart Diagrams quick and easy.HelpDesk
How to Make a Logistic Dashboard
The business data represented in the view of dashboard can show the real picture of the activity of the entire organization, or it can display particular information like website effectiveness, call center statistics, and more business KPIs in the company. Dashboards provides managers, marketers, and analysts to quickly sort out the position of the company and to determine the weakest links. The dashboard helps to to compare easily different stages of business process and to accomplish the right decision. Business Intelligence Solution for ConceptDraw PRO makes for a powerful analytical tool that displays an organization’s processes and provides valuable competitive insight into business performance.SWOT Analysis
The success of the company depends on how successfully it is able to react on different outside influences. When analyzing the external situation, it is necessary to identify the factors most significant on a specified period of time. An interrelated consideration of these factors with the company's possibilities allows to solve effectively appearing problems. One of the most common methods of assessment together internal and external factors influencing the company's development is a SWOT analysis. SWOT analysis (acronym composed of the first letters of the words: strength, weakness, opportunities, threats) is one of the most common and effective types of analysis in marketing and marketing researches. It allows to identify and structure the strengths and weaknesses of an enterprise, as well as potential opportunities and threats of the market, to make conclusion in which direction a given organization needs to develop its business and to formulate the organization's strategy. Use the ConceptDraw MINDMAP software and offered SWOT analysis templates for easy holding SWOT analysis for your company. This Mind Map displays the SWOT analysis for a company and variety of performance measures that influence its work.Technical Flow Chart
Flow chart is a diagrammatic representation of an algorithm and essential part of planning the system. Flow charts are widely used in technical analysis and programming for easy writing programs and explaining them to others. So, one of the most popular type of flow charts is Technical Flow Chart. Technical Flow Chart can be drawn by pencil on the paper, but it will be easier to use for designing a special software. ConceptDraw PRO diagramming and vector drawing software extended with Flowcharts Solution from the "Diagrams" Area of ConceptDraw Solution Park will be useful for this goal.Cross Functional Flowchart Examples
Take a look on an example of Cross-Functional-Flowchart, showing the software service cross-function process flowcharts among the different departments. It presents a simple flowchart among the customer, sales, technical support, tester and development. Try now Flowchart Software and Cross-Functional library with 2 libraries and 45 vector shapes of the Cross-Functional Flowcharts solution. Then you can use built-in templates to create and present your software service cross-function process flowcharts.Think. Act. Accomplish.
ConceptDraw MINDMAP is ready to provide you with mind mapping tool which can serve as comprehensive productivity tool for your business.- Supply Chain Management Flow Diagram
- Supply Chain Order Process Flow Chart Template
- Supply Chain Process Flow Chart Templates
- Supply Chain Flow Chart Template
- Supply Chain Business Process Flow Diagram
- Supply Chain Process Flow Diagram
- Process Flowchart | Types of Flowcharts | Total Quality Management ...
- Process Supply Chain Management Flow Chart
- Supply Chain Management Er
- Process Flowchart | Dhl Supply Chain Diagram
- Process Flowchart | Logistics Flow Charts | Cross-Functional ...
- Process Flowchart | Value stream map - Template | SWOT Analysis ...
- Supply Chain Flowcharts
- Logistics Flow Charts | Process Flowchart | Supply chain network ...
- Process Flowchart | Total Quality Management Definition | Types of ...
- Process Flowchart | Total Quality Management Definition | Logistics ...
- Supply Chain Management Process Flow Documents
- Supply Chain Symbols Flowchart In Visio
- Diagram Of Internal Supply Chain
- Business Process Mapping Methods In Supply Chain Management


