Daily Planning
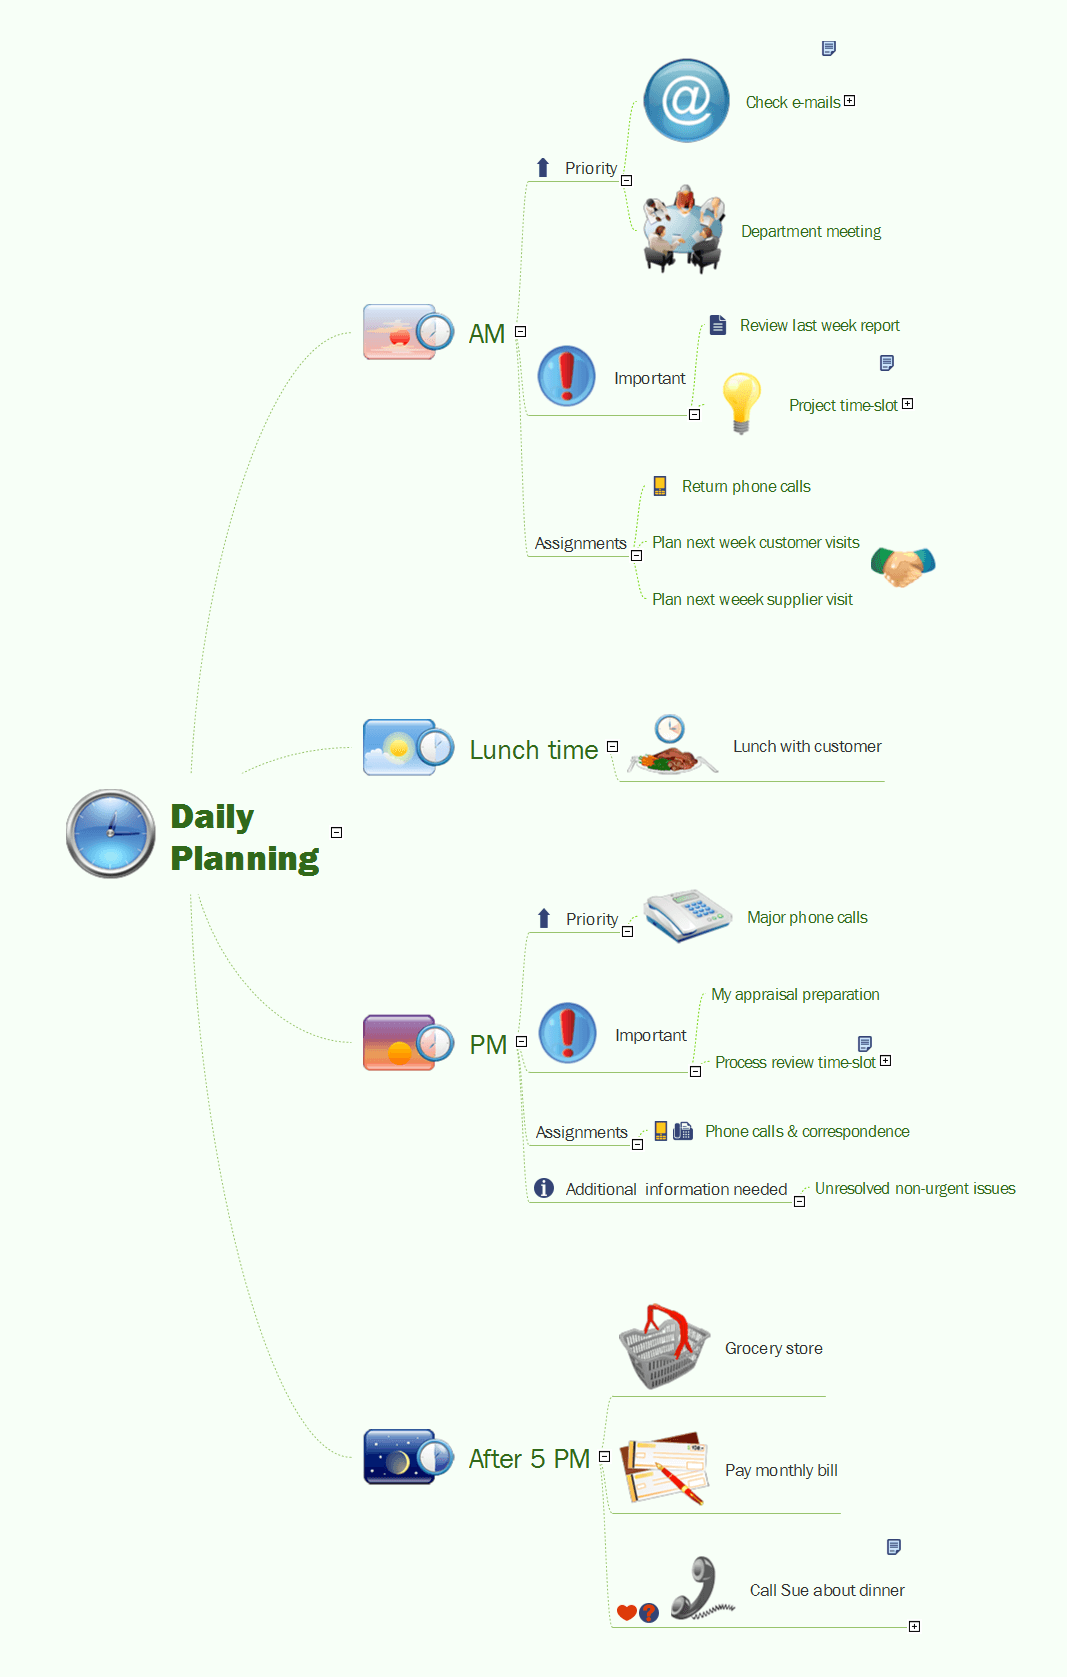
The time is priceless, so it is useful to rationally and productively arrange our day. The managing and organizing of time helps in increasing efficiency and in rising chances on the success. One of the best tools for personal time planning, self-organization and self-improvement is a Mind Map. It can become a great helper at your life, from the preparation your daily schedule to definition your life purpose. The Mind Map is a useful way to make convenient plan of working on the day, week, month, year. A well thought-out Mind Map is a guarantee of holding productive day and a great help at certain moments in order to not miss important affairs and events. Besides, a Mind Map is a very good way to keep your focus through the day and improve your quality of life. Organize and schedule easy each your day using the mind mapping technique and ConceptDraw MIDMAP software powerful in questions of mind mapping and organizing a daily schedule. It lets visually represent all important tasks and affairs on a single Daily Planning Mind Map, and lets highlight the most important and urgent tasks using the special symbols and clipart.Management Tools — Total Quality Management
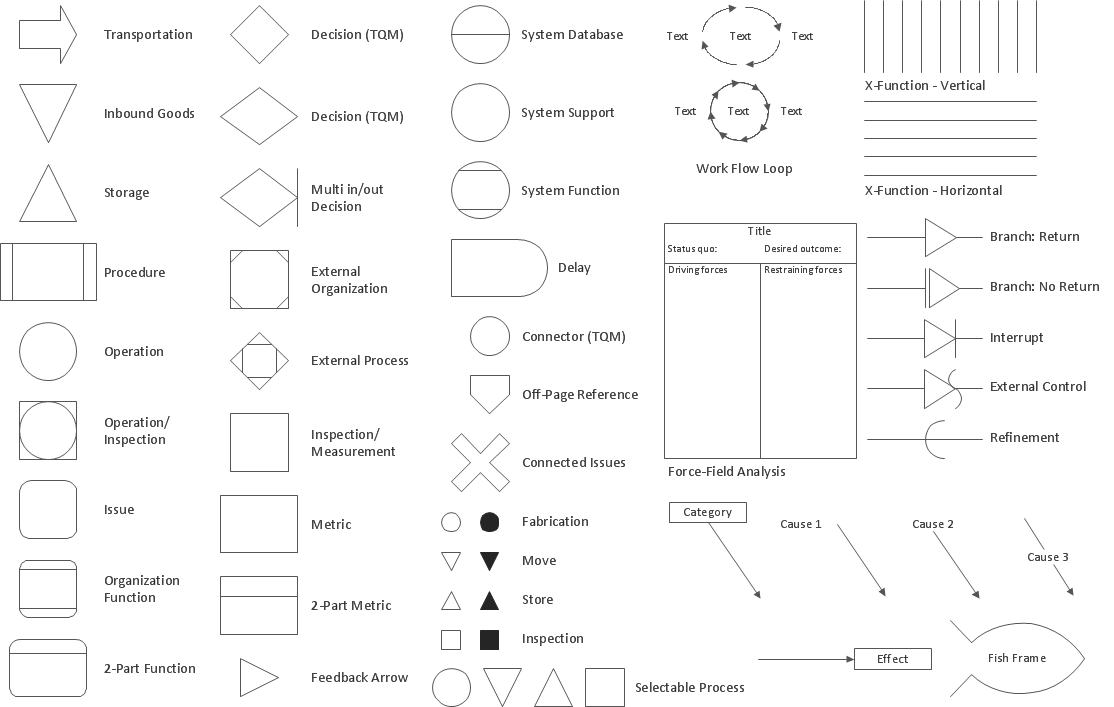
The Total Quality Management Diagram solution helps your organization visualize business and industrial processes. Create Total Quality Management diagrams for business process with ConceptDraw software.Relations Diagram
The Relations Diagram is used to identify how the factors influence each other, to determine what factors are causes and what are effects. The factors mostly influencing are called “drivers”, the primarily affected factors are “indicators”. The problem solving is focused on the change of "drivers" factors by applying the corrective actions. The "indicators" factors help establish the Key Performance Indicators (KPIs) to monitor the changes and also define the effectiveness of the corrective actions in resolving a problem. ConceptDraw MINDMAP software ideally suits for designing Relations Diagrams. The easiest way to create the MINDMAP Relations Diagram, is to use the included Relations Diagram input template. Open it in ConceptDraw MINDMAP application from the Input tab and hold a new brainstorming session, identify the central issue and the contributing factors to this issue. Click the Finish Brainstorm button to generate a Mind Map and begin the further work with it, or select Relations Diagram item from the Output tab to automatically draw it in ConceptDraw PRO application.Cause and Effect Diagram
ConceptDraw PRO software extended with Fishbone Diagrams solution from the Management area of ConceptDraw Solution Park is perfect for Cause and Effect Diagram creating. It gives the ability to draw fishbone diagram that identifies many possible causes for an effect or a problem. Causes and Effects are usually grouped into major categories to identify these sources of variation. Causes and Effects in the diagram show relationships among various factor. Fishbone diagram shows factors of Equipment, Process, People, Materials, Environment and Management, all affecting the overall problem.Activity Network Diagram Method
Activity Network Diagram - This sample was created in ConceptDraw PRO diagramming and vector drawing software using the Seven Management and Planning Tools solution from the Management area of ConceptDraw Solution Park. This sample shows the PERT (Program Evaluation Review Technique) chart of the request on proposal. A request for proposal (RFP) is a request of the company or the organization to potential suppliers to submit the business proposals for service or goods that it is interested to purchase. The RFP is represented on the initial procurement stage and allows to define the risks and benefits.TQM Diagram — Professional Total Quality Management
The Total Quality Management Diagram solution helps you and your organization visualize business and industrial processes. Create Total Quality Management diagrams for business process with ConceptDraw software.Quality Management Teams
ConceptDraw MINDMAP with Quality mindmaps solution as a demonstration of the creative approach to quality management in daily work of quality management team.The Action Plan
Action Plan - For the action planning define people and groups involvement in corrective actions by roles, identify logical sequences of scheduled actions and critical path of problem solving, identify possible risks of action plan and propose preventive actions. ConceptDraw Office suite is a software for decision making and action plan.
Total Quality Management Business Diagram
The Total Quality Management Diagram solution helps you and your organization visualize business and industrial processes. Create Total Quality Management diagrams for business process with ConceptDraw software.Cause and Effect Diagram Software
The Cause and Effect diagram introduced by Kaoru Ishikawa in 1968 is a method for analyzing process dispersion. It can help you to dive into a problem and find an effective solution, identify and represent the possible causes for an effect, analyze the complex business problems and successfully solve them. You can design your Cause and Effect diagram on a paper, but more effective way is to use specific software - ConceptDraw PRO is a powerful Cause and Effect Diagram Software. It helps you create Cause and Effect diagram known also as Fishbone diagram or Ishikawa diagram from templates and examples.Activity Network (PERT) Chart
Activity Network and Project Evaluation and Review Technique, or PERT, charts are a way of documenting and analyzing the tasks in a project. This diagram is constructed as part of the process in creating a schedule of corrective actions. The Activity Network Chart (PERT) shows the logical connections and consequence of tasks to be performed. It displays the time period for problem solving and the implementation of all activities through the critical path.Activity on Node Network Diagramming Tool
Activity on Node Network Diagramming Tool - Activity Network and Project Evaluation and Review Technique, or PERT, charts are a way of documenting and analyzing the tasks in a project. This sample shows the Activity on node network diagramming method. It was created in ConceptDraw PRO diagramming and vector drawing software using the Seven Management and Planning Tools solution from the Management area of ConceptDraw Solution Park.Use a Fishbone Diagram to Attack Complex Problems
Any project is a complex system which rarely goes without some problems, even the most minor. But the success of the project mostly depends from the ability effectively solve appearing problems. There are many methods for problem solving, one of the most effective is the use a Fishbone diagram to attack complex problems. Use ConceptDraw PRO diagramming software with Fishbone Diagrams Solution to attack any complex problems with fishbone diagrams graphic method. Construct Fishbone diagram to help users brainstorm and break down a complex problem.Total Quality Management Density
The Total Quality Management Diagram solution helps you and your organization visualize business and industrial processes. Create Total Quality Management diagrams for business process with ConceptDraw software.Cause and Effect Analysis
When you have some problems you need first to explore the reasons which caused them. Cause and Effect Analysis is a perfect way to do this. ConceptDraw PRO software enhanced with Fishbone Diagrams solution from the Management area of ConceptDraw Solution Park gives the ability to draw fast and easy Fishbone diagram that identifies many possible causes for an effect.- Project plan timeline - Request for proposal (RFP) | Activity Network ...
- SWOT Analysis | SWOT Matrix | PROBLEM ANALYSIS . Root Cause ...
- Sales Process Flowchart. Flowchart Examples | Sales Process ...
- PROBLEM ANALYSIS. Root Cause Analysis Tree Diagram | Bar ...
- Root cause analysis tree diagram - Personal problem solution ...
- How To Create Root Cause Analysis Diagram Using ConceptDraw ...
- How To Create Root Cause Analysis Diagram Using ConceptDraw ...
- Presentations in Educational Process | Visual Presentations Made ...
- Manufacturing 8 Ms fishbone diagram - Template | How Do ...
- How To Create Root Cause Analysis Diagram Using ConceptDraw ...
- Customer types matrix | PROBLEM ANALYSIS . Prioritization Matrix ...
- Blank Calendar Template | Fishbone Diagram Template | Fishbone ...
- Root Cause Analysis Dashboard
- Root cause analysis tree diagram - Personal problem solution | How ...
- Program Evaluation and Review Technique (PERT) with ...
- Business and Finance | SWOT Analysis | Ansoff's product / market ...
- Root cause analysis tree diagram - Personal problem solution | Root ...
- How To use House Electrical Plan Software | Seven Management ...
- Fault Tree Diagram | Pyramid Diagram and Pyramid Chart | How to ...
- Hotel Network Topology Diagram | Seven Management and ...


