Swim Lane Flowchart Symbols

"Crow's Foot notation is used in Barker's Notation, SSADM and Information Engineering. Crow's Foot diagrams represent entities as boxes, and relationships as lines between the boxes. Different shapes at the ends of these lines represent the cardinality of the relationship." [Entity–relationship model. Wikipedia]
The vector stencils library ERD, crow's foot notation contains 18 symbols for creating the ER-diagrams using the ConceptDraw PRO diagramming nd vector drawing software.
The example"Design elements - ERD solution (crow's foot notation)" is included in the Entity-Relationship Diagram (ERD) solution from the Software Development area of ConceptDraw Solution Park.
Crow's foot ERD
.png--diagram-flowchart-example.png)
Flowchart Software


Express-G Diagram

SDL Flowchart Symbols

How to Simplify Flow Charting — Cross-functional Flowchart

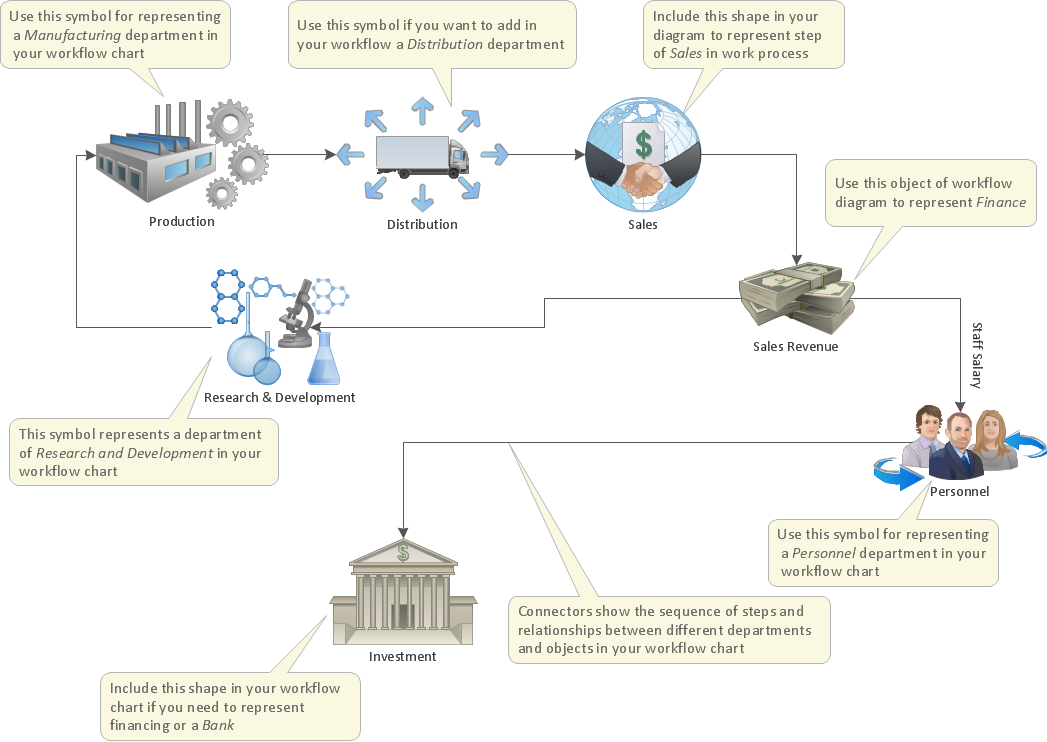
Tools and Software to Improve Your Workflow
Work Process
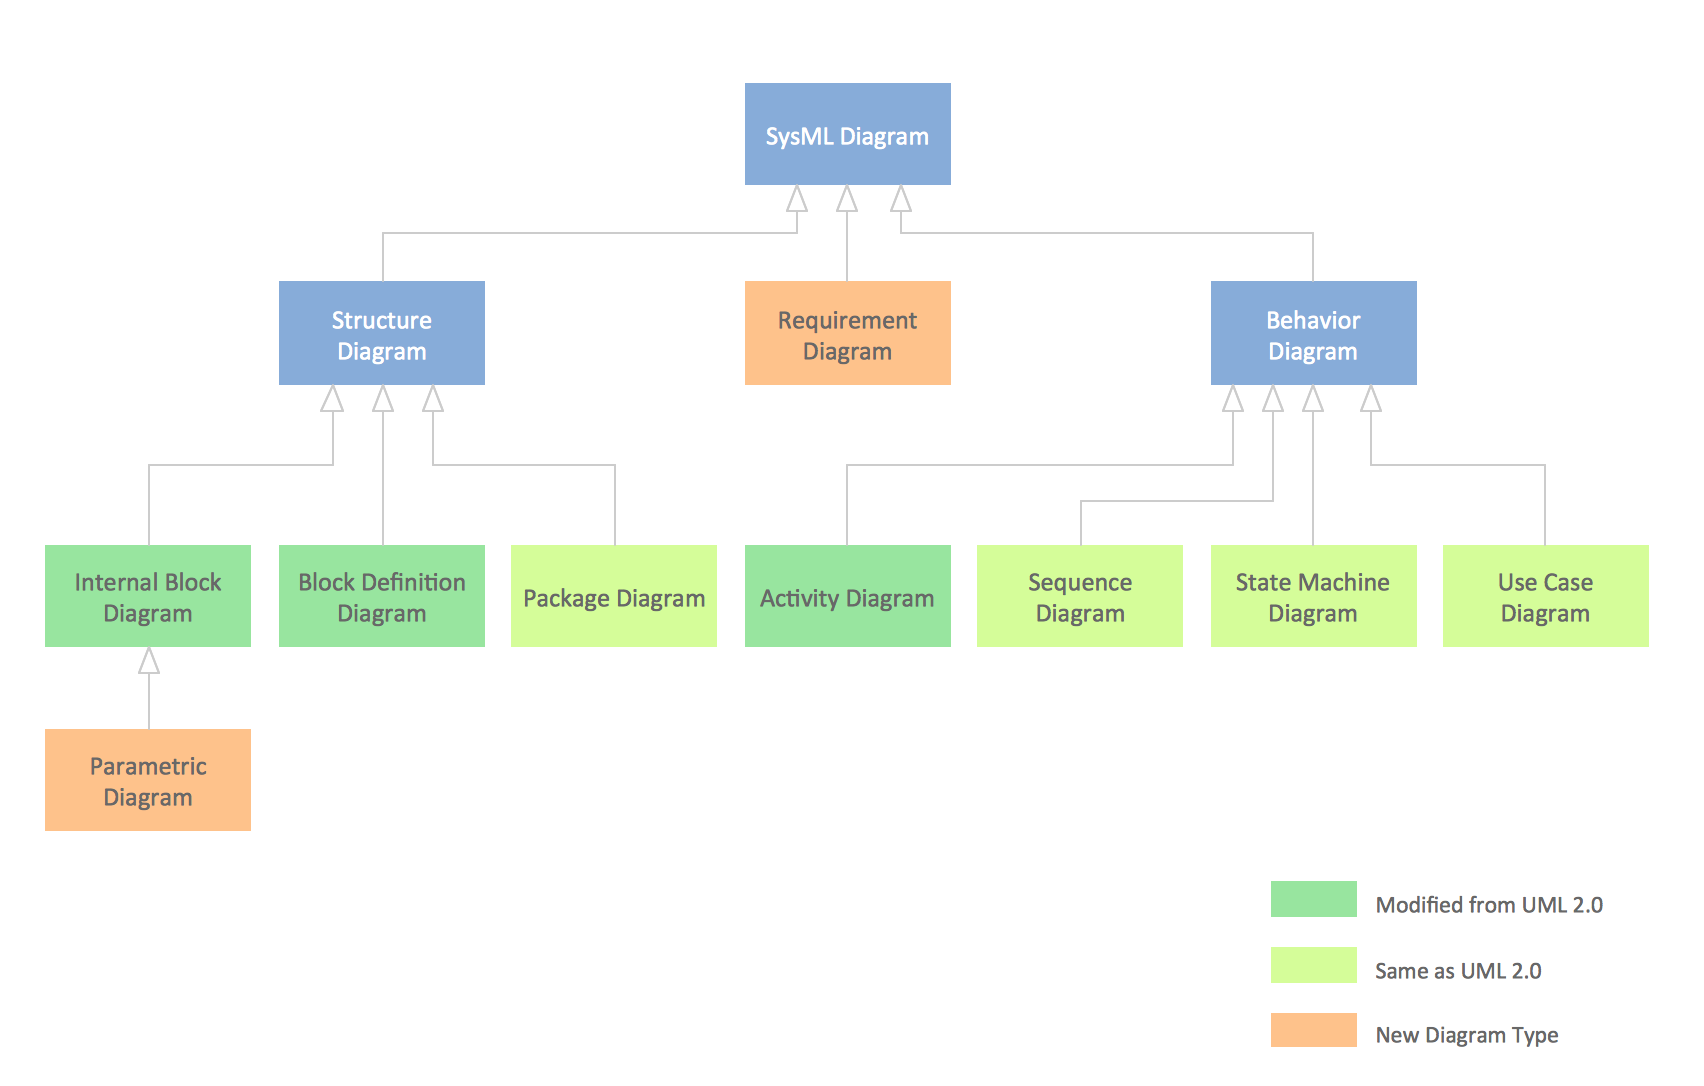
SysML Diagram
Venn Diagram Examples for Problem Solving. Computer Science. Chomsky Hierarchy

SysML

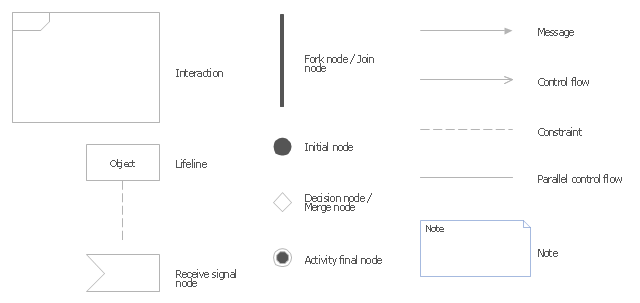
The vector stencils library "UML interaction overview diagrams" contains 13 symbols for the ConceptDraw PRO diagramming and vector drawing software.
"Interaction Overview Diagram is one of the fourteen types of diagrams of the Unified Modeling Language (UML), which can picture a control flow with nodes that can contain interaction diagrams.
The interaction overview diagram is similar to the activity diagram, in that both visualize a sequence of activities. The difference is that, for an interaction overview, each individual activity is pictured as a frame which can contain a nested interaction diagrams." [Interaction overview diagram. Wikipedia]
"Interaction diagrams.
Interaction diagrams, a subset of behavior diagrams, emphasize the flow of control and data among the things in the system being modeled:
(1) Communication diagram: shows the interactions between objects or parts in terms of sequenced messages. They represent a combination of information taken from Class, Sequence, and Use Case Diagrams describing both the static structure and dynamic behavior of a system.
(2) Interaction overview diagram: provides an overview in which the nodes represent interaction diagrams.
(3) Sequence diagram: shows how objects communicate with each other in terms of a sequence of messages. Also indicates the lifespans of objects relative to those messages.
(4) Timing diagrams: a specific type of interaction diagram where the focus is on timing constraints." [Unified Modeling Language. Wikipedia]
The example "Design elements - UML interaction overview diagrams" is included in the Rapid UML solution from the Software Development area of ConceptDraw Solution Park.
UML interaction overview diagram symbols
Management Tools — Total Quality Management

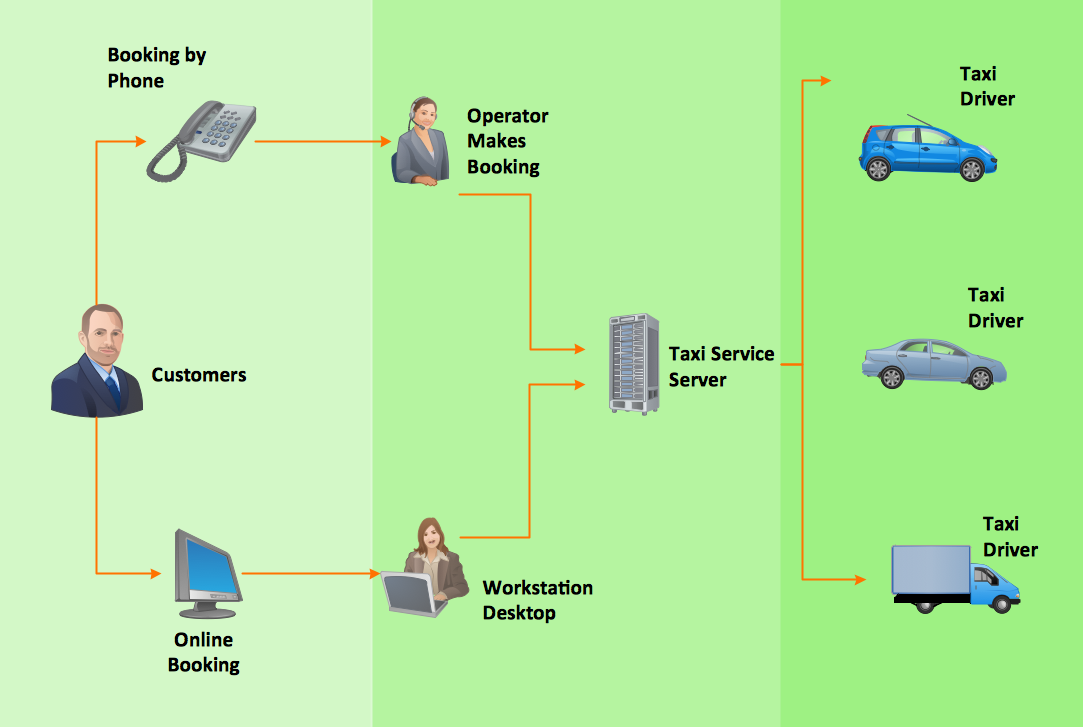
Software Work Flow Process in Project Management with Diagram

This sample shows the Workflow Diagram that clearly illustrates stages a BPM consists of and relations between all parts of business. The Workflow Diagrams are used to represent the transferring of data during the work process, to study and analysis the working processes, and to optimize a workflow.
Workflow Diagram Data

- Process Flowchart | Basic Flowchart Symbols and Meaning | Flow ...
- Basic Flowchart Symbols and Meaning | Workflow Diagram ...
- UML Class Diagram Notation | Entity Relationship Diagram Symbols ...
- Train Symbol All Chart
- Swim Lane Diagrams | Swim Lane Flowchart Symbols | Swim Lanes ...
- Mechanical Drawing Symbols | Process Flowchart | Design ...
- Basic Flowchart Symbols and Meaning | Process Flowchart ...
- Basic Flowchart Symbols and Meaning | Yourdon and Coad ...
- ERD Symbols and Meanings | Entity Relationship Diagram Symbols ...
- Basic Flowchart Symbols and Meaning | Process Flowchart | Audit ...
- Basic Flowchart Symbols and Meaning | Audit Flowchart Symbols ...
- Basic Flowchart Symbols and Meaning | Design elements - HVAC ...
- Basic Flowchart Symbols and Meaning | Accounting Flowchart ...
- Basic Flowchart Symbols and Meaning | Flow Chart Symbols | Swim ...
- Basic Flowchart Symbols and Meaning | Cross-Functional Flowchart ...
- Basic Flowchart Symbols and Meaning | Flow Chart Symbols ...
- Basic Flowchart Symbols and Meaning | Process Flowchart | Audit ...
- Draw Symbol To Find Meaning
- Symbols For Interaction Overview Diagram
- Workflow Diagram Symbols | BPR Diagram. Business Process ...