Swot Analysis Examples

 Health Food
The Health Food solution contains the set of professionally designed samples and large collection of vector graphic libraries of healthy foods symbols of fruits, vegetables, herbs, nuts, beans, seafood, meat, dairy foods, drinks, which give powerful possi
SWOT Sample in Computers

 Picture Graphs
Typically, a Picture Graph has very broad usage. They many times used successfully in marketing, management, and manufacturing. The Picture Graphs Solution extends the capabilities of ConceptDraw DIAGRAM with templates, samples, and a library of professionally developed vector stencils for designing Picture Graphs.
What is a Quality Management

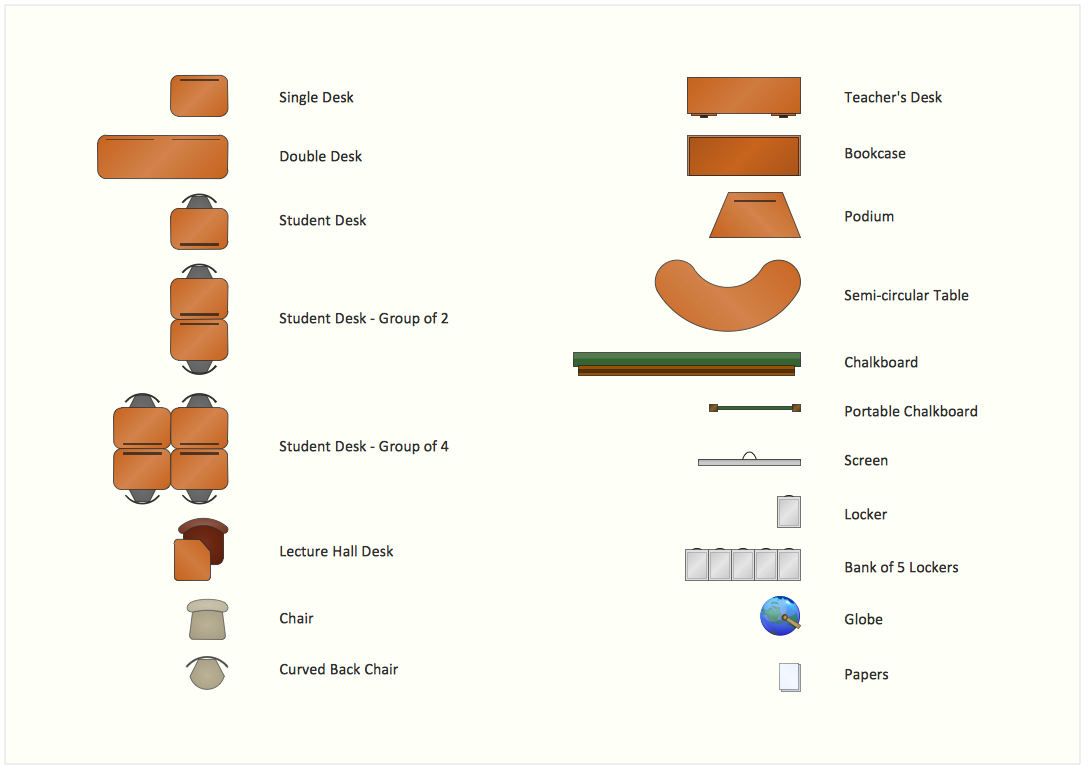
Interior Design. School Layout — Design Elements
ERD Symbols and Meanings


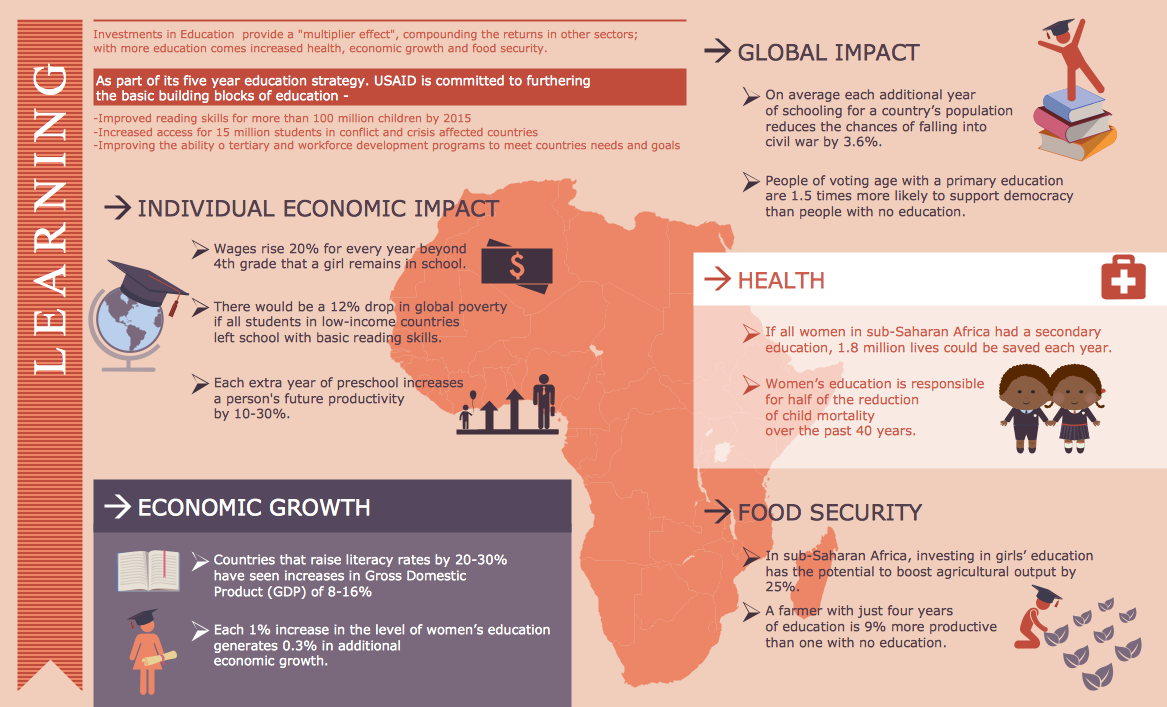
Education Infographics
SWOT Analysis Software

Business Tools Perceptual Mapping

BCG Matrix

Software for Creating SWOT Analysis Diagrams

Biology Drawing

SWOT analysis Software & Template for Macintosh and Windows

- Basic Diagramming | Regional population growth from 2010 to 2016 ...
- Pictures of Graphs | Pictures of Vegetables | Pictures of Food | Pict ...
- Basic Flowchart Images . Flowchart Examples | Chart Maker for ...
- Pictures of Vegetables | Food Images | Fruit Art | Image Clipart Dessert
- Professions - Vector stencils library | Project management - Design ...
- Professions - Vector stencils library | Professions - Vector stencils ...
- Professions - Vector stencils library | Project management - Design ...
- Professions - Vector stencils library | Geo Map - Asia - Japan | ABC ...
- Professions - Vector stencils library | HR professions - Vector ...
- Picture Graphs | Graphs and Charts Area | Population growth by ...
- Business People Clipart | People - Vector stencils library | Design ...
- Basic Diagramming | Food Court | Examples of Flowcharts, Org ...
- How to Draw a Pictorial Chart in ConceptDraw PRO | How to Draw ...
- Population Flow Chart Or Diagram Images
- People - Vector stencils library | Business People Clipart | Design ...
- Line Graphs | Basic Line Graphs | Competitor Analysis | What Are ...
- Business people pictograms - Vector stencils library | People ...
- Flowchart design. Flowchart symbols, shapes, stencils and icons ...
- People pictograms - Vector stencils library | People - Vector stencils ...
- Information Graphic | Educational Technology Tools | Biology ...