 Picture Graphs
Typically, a Picture Graph has very broad usage. They many times used successfully in marketing, management, and manufacturing. The Picture Graphs Solution extends the capabilities of ConceptDraw PRO v10 with templates, samples, and a library of professionally developed vector stencils for designing Picture Graphs.
 Graphs and Charts Area
Solutions from the Graphs and Charts Area of ConceptDraw Solution Park collect templates, samples and libraries of vector stencils for visualization of numerical data.
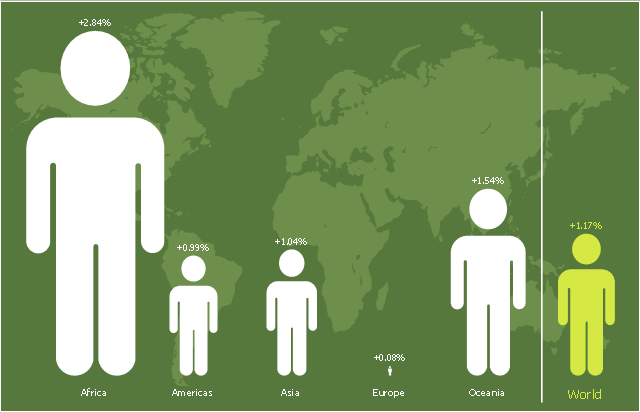
"Population growth' refers to the growth in human populations. Global population growth is around 80 million annually, or 1.2% p.a. The global population has grown from 1 billion in 1800 to 7 billion in 2012. It is expected to keep growing to reach 11 billion by the end of the century. Most of the growth occurs in the nations with the most poverty, showing the direct link between high population growth and low standards of living. The nations with high standards of living generally have low or zero rates of population growth. Australia's population growth is around 400,000 annually, or 1.8% p.a., which is nearly double the global average. It is caused mainly by very high immigration of around 200,000 p.a., the highest immigration rate in the world. Australia remains the only nation in the world with both high population growth and high standards of living." [Population growth. Wikipedia]
The pictorial chart example "Population growth by continent, 2010 - 2013" was created using the ConceptDraw PRO diagramming and vector drawing software extended with the Picture Graphs solution from the Graphs and Charts area of ConceptDraw Solution Park.
The pictorial chart example "Population growth by continent, 2010 - 2013" was created using the ConceptDraw PRO diagramming and vector drawing software extended with the Picture Graphs solution from the Graphs and Charts area of ConceptDraw Solution Park.
Image chart
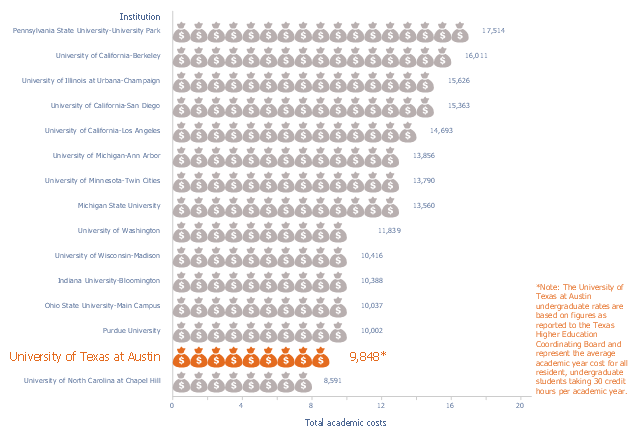
This image chart sample was drawn on the base of data from the website of the Office of Information Management and Analysis of the University of Texas at Austin.
"Undergraduate tuition and fees are based on 30 credit hours enrolled per academic year or full-time tuition as defined by the institution."
[utexas.edu/ tuition/ attach/ 2013-14_ NCG_ Tuition_ and_ Fees_ Table_ 20131122.pdf]
"Tuition payments, known primarily as tuition in American English and as tuition fees in British English, Canadian English, Australian English, New Zealand English and Indian English, refers to a fee charged for educational instruction during higher education.
Tuition payments are charged by educational institutions in some countries to assist with funding of staff and faculty, course offerings, lab equipment, computer systems, libraries, facility upkeep and to provide a comfortable student learning experience. In most countries, especially in non-English-speaking countries, there are no or only nominal tuition fees for all forms of education, including university and other higher education." [Tuition payments. Wikipedia]
The picture graph example "Resident undergraduate tuition and fees at national comparison group institutions, academic year 2013-14" was created using the ConceptDraw PRO diagramming and vector drawing software extended with the Picture Graphs solution from the Graphs and Charts area of ConceptDraw Solution Park.
Pictorial chart
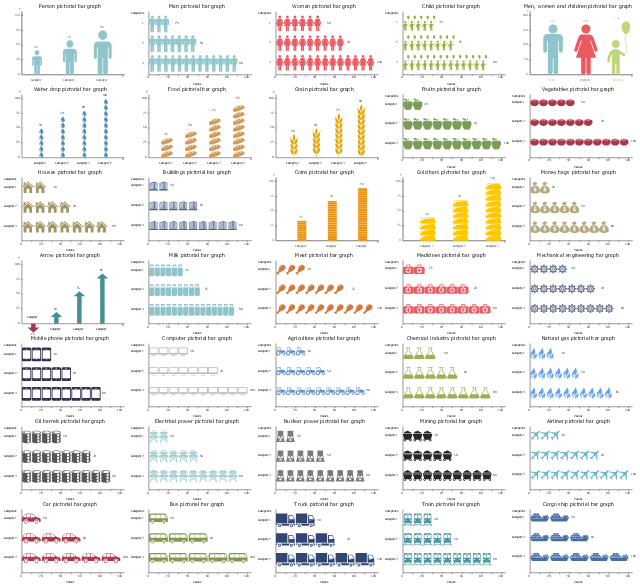
"Pictorial bar graph.
Sometimes reffered to as a pictographs. A pictorial bar graph is a graph in which the rectangular bars have been filled with pictures, sketches, icons, etc. or where pictures, sketches, icons, etc. have been substituted for the rectangular bars. In both variations, one or more symbols might be used in each bar. The two major reasons for using pictorial graphs are to make the graph more appealing visually and to facilitate better communications." [Information Graphics: A Comprehensive Illustrated Reference. R. L. Harris. 1999. p.41]
The example"Design elements - Picture graphs" was created using the ConceptDraw PRO diagramming and vector drawing software extended with the Picture Graphs solution from the Graphs and Charts area of ConceptDraw Solution Park.
Pictorial chart templates
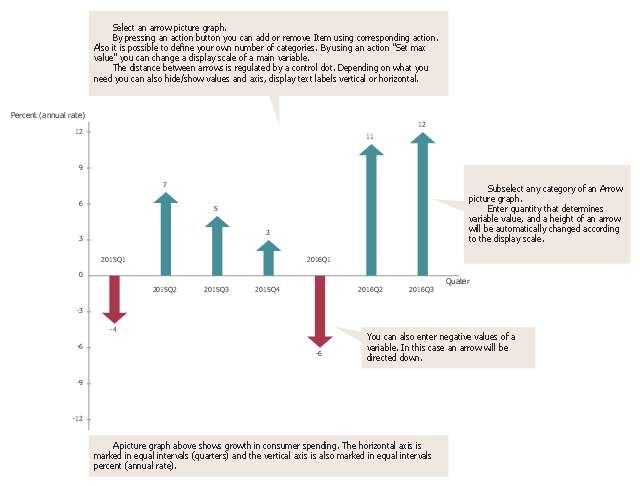
A picture chart (image chart, pictorial graph) is the type of a bar graph visualizing numarical data using symbols and pictograms.
In the field of economics and finance use a picture graph with columns in the form of coins. For population comparison statistics use a chart with columns in the form of manikins. To show data increase or decrease use arrows bar charts.
The picture graph template for the ConceptDraw PRO diagramming and vector drawing software is included in the Picture Graphs solution from the Graphs and Charts area of ConceptDraw Solution Park.
Arrows bar graph template
 Organizational Charts
Organizational Charts solution extends ConceptDraw PRO software with samples, templates and library of vector stencils for drawing the org charts.
Chart Software for Better Presentations

Graphs and Charts Area provide a wide collection of professional looking predesigned templates, samples and ready-to-use vector stencils that will help you to draw the charts and diagrams of various types: Pie Charts, Donut Charts, Line Charts, Column Charts, Bar Charts, Pyramids, Scatter Charts, Venn Diagrams, Spider Charts, Area Charts, Divided Bar Graphs.
 ConceptDraw Solution Park
ConceptDraw Solution Park collects graphic extensions, examples and learning materials
 Pie Charts
Pie Charts are extensively used in statistics and business for explaining data and work results, in mass media for comparison (i.e. to visualize the percentage for the parts of one total), and in many other fields. The Pie Charts solution for ConceptDraw PRO v10 offers powerful drawing tools, varied templates, samples, and a library of vector stencils for simple construction and design of Pie Charts, Donut Chart, and Pie Graph Worksheets.
 Area Charts
Area Charts are used to display the cumulative totals over time using numbers or percentages; or to show trends over time among related attributes. The Area Chart is effective when comparing two or more quantities. Each series of data is typically represented with a different color, the use of color transparency in an object’s transparency shows overlapped areas and smaller areas hidden behind larger areas.
 Accounting Flowcharts
Accounting Flowcharts solution extends ConceptDraw PRO software with templates, samples and library of vector stencils for drawing the accounting flow charts.
 Cross-Functional Flowcharts
Cross-functional flowcharts are powerful and useful tool for visualizing and analyzing complex business processes which requires involvement of multiple people, teams or even departments. They let clearly represent a sequence of the process steps, the order of operations, relationships between processes and responsible functional units (such as departments or positions).
 Audit Flowcharts
Audit flowcharts solution extends ConceptDraw PRO software with templates, samples and library of vector stencils for drawing the audit and fiscal flow charts.
- Picture Graphs | Line Graphs | Create Graphs and Charts |
- Picture graph template | Picture Graphs | Bar Chart Software |
- Basic Diagramming | Picture Graphs | Create Graphs and Charts |
- Picture Graphs | Picture graph template | Design elements - Picture ...
- Line Chart Examples | Chart Examples | Picture Graphs |
- Picture Graphs | Flowchart Example: Flow Chart of Marketing ...
- Picture Graphs | Marketing Analysis Diagram | Flowchart Example ...
- Picture graph template | Area Charts | Basic Diagramming |
- Double Bar Graph | Chart Maker for Presentations | Picture Graphs |
- Marketing | SWOT Sample in Computers | Picture Graphs |
- Picture Graphs | Picture graph - Population growth by continent ...
- Graphs and Charts Area | Bar Graphs | Picture Graphs |
- Basic Diagramming | Picture Graphs |
- Graphs and Charts Area | Mind Map Making Software | Picture ...
- Picture graph - Population growth by continent, 2010 - 2013 | Line ...
- Examples of Flowcharts, Org Charts and More | Business Diagram ...
- Line Chart Examples | Chart Examples | Picture graph - Population ...
- Basic Diagramming | Area Charts | Picture Graphs |
- Picture Graphs | Picture graph template | Line Graphs |
- Design elements - Picture graphs | Bar Chart Software | Column ...