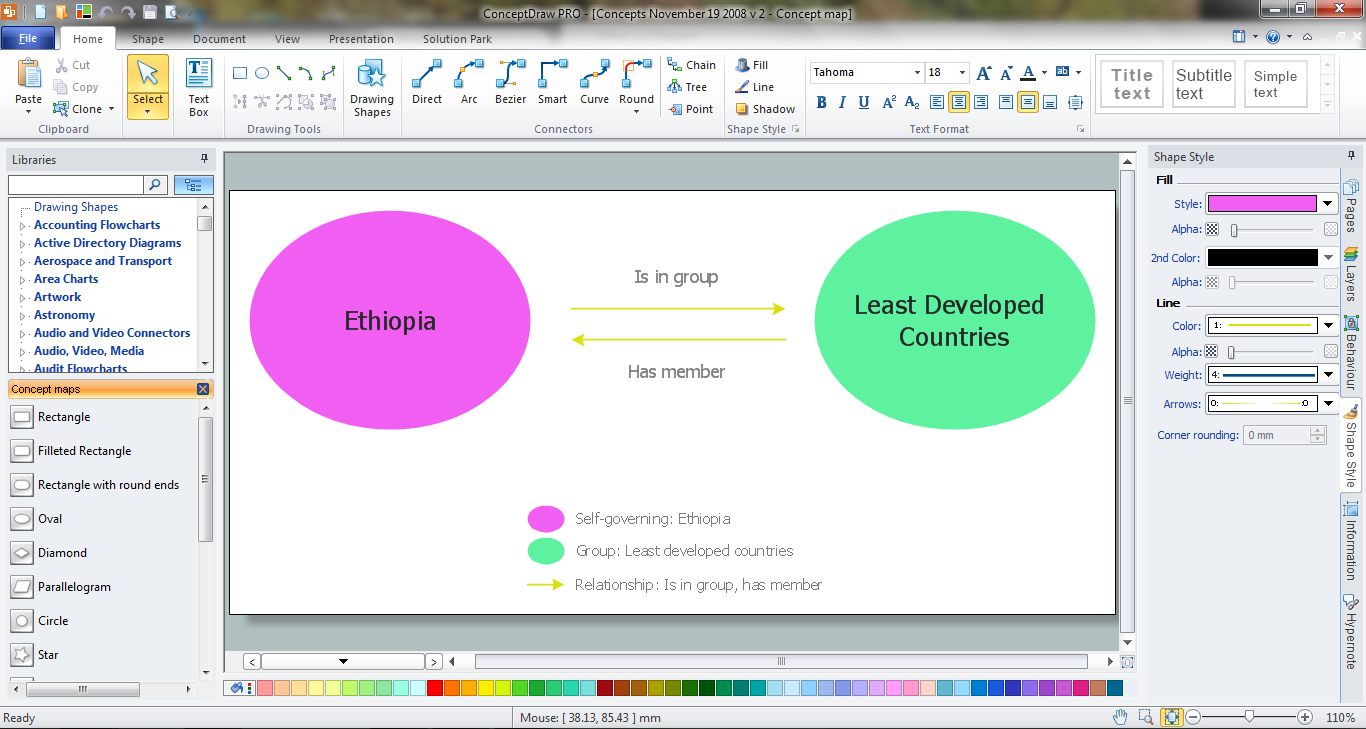
This site uses cookies. By continuing to browse the ConceptDraw site you are agreeing to our Use of Site Cookies.

Competitor Analysis

Competitor analysis is a first and obligatory step in elaboration the proper corporate marketing strategy and creating sustainable competitive advantage. Use powerful opportunities of numerous solutions from ConceptDraw Solution Park for designing illustrative diagrams, charts, matrices which are necessary for effective competitor analysis.

Concept Map Maker

ConceptDraw DIAGRAM diagramming and vector drawing software extended with Concept Maps Solution from the "Diagrams" Area is a powerful Concept Map Maker.

SWOT Analysis

The success of the company depends on how successfully it is able to react on different outside influences. When analyzing the external situation, it is necessary to identify the factors most significant on a specified period of time. An interrelated consideration of these factors with the company's possibilities allows to solve effectively appearing problems. One of the most common methods of assessment together internal and external factors influencing the company's development is a SWOT analysis. SWOT analysis (acronym composed of the first letters of the words: strength, weakness, opportunities, threats) is one of the most common and effective types of analysis in marketing and marketing researches. It allows to identify and structure the strengths and weaknesses of an enterprise, as well as potential opportunities and threats of the market, to make conclusion in which direction a given organization needs to develop its business and to formulate the organization's strategy. Use the ConceptDraw MINDMAP software and offered SWOT analysis templates for easy holding SWOT analysis for your company. This Mind Map displays the SWOT analysis for a company and variety of performance measures that influence its work.

BCG Matrix

The growth–share matrix (BCG Matrix) was created by Bruce D. Henderson for the Boston Consulting Group in 1970 to help corporations to analyze their business units and to help the company allocate resources. How is it easy design the BCG Matrices in ConceptDraw DIAGRAM diagramming and vector drawing software supplied with unique Matrices Solution from the Marketing Area of ConceptDraw Solution Park.

marketing diagram, marketing chart Marketing Diagrams

marketing diagram, marketing chart
Marketing Diagrams solution extends ConceptDraw DIAGRAM diagramming software with abundance of samples, templates and vector design elements intended for easy graphical visualization and drawing different types of Marketing diagrams and graphs, including Branding Strategies Diagram, Five Forces Model Diagram, Decision Tree Diagram, Puzzle Diagram, Step Diagram, Process Chart, Strategy Map, Funnel Diagram, Value Chain Diagram, Ladder of Customer Loyalty Diagram, Leaky Bucket Diagram, Promotional Mix Diagram, Service-Goods Continuum Diagram, Six Markets Model Diagram, Sources of Customer Satisfaction Diagram, etc. Analyze effectively the marketing activity of your company and apply the optimal marketing methods with ConceptDraw DIAGRAM software.

Stakeholder Mapping Tool

Stakeholders are the groups of people or organizations whose contribution matters to the organization's success, this can be labour participation, financial participation, dissemination of information about organization, etc. So, the employees of the company, its suppliers, customers, media, public organizations, state authorities, all they are stakeholders of the company. ConceptDraw DIAGRAM diagramming and vector drawing software extended with Stakeholder Onion Diagrams Solution from the Management Area of ConceptDraw Solution Park is a powerful stakeholder mapping tool which allows easy create Stakeholder Onion diagrams and maps depicting the layers of a project, relationships of stakeholders to a project goal, and relationships between stakeholders.

What is SWOT Analysis in Marketing

What is SWOT analysis in marketing? SWOT analysis gives for analysts, marketing specialists and other professionals the perfect ability to identify the positives and negatives in an organization, as well as in the external environment. The SWOT and TOWS methods were developed for business and industry, they involve the specifying of a project's objective and identifying internal and external causes for accomplishing the project goals. A full awareness about the situation within and around your business can help effectively with both strategic planning and decision-making. ConceptDraw DIAGRAM and ConceptDraw MINDMAP software allow professionals to make the situation analysis, to develop strategies and plans for achievement defined objectives, to suppose the possible scenarios of further activity, to see the whole situation at a glance, to create well-designed SWOT and TOWS matrices in minutes. The SWOT and TOWS Matrix Diagrams solution from ConceptDraw Solution Park includes the SWOT matrix samples and templates that allow users quickly create their own SWOT and TOWS diagrams.

Fishbone Diagram Problem Solving

The Ishikawa diagram, Cause and Effect diagram, Fishbone diagram — all they are the names of one and the same visual method for working with causal connections. Originally invented by Kaoru Ishikawa to control the process quality, the Ishikawa diagram is well proven in other fields of management and personal scheduling, events planning, time management. It is a chart in the form of a fish, whose head is a problem, the fins are variants for its causes. To design easily the Fishbone diagram, you can use a special ConceptDraw DIAGRAM ector graphic and diagramming software which contains the powerful tools for Fishbone diagram problem solving offered by Fishbone Diagrams solution for the Management area of ConceptDraw Solution Park.

Flowchart design. Flowchart symbols, shapes, stencils and icons

A flowchart is a type of diagram which represents an algorithm, process or workflow, displays the steps as boxes of various kinds and depicts their order by connecting them with arrows. Any business graphic document will be more colorful and understandable if will use professional-looking and visual diagrams and flowcharts. Flowchart design gives versatile presenting and explaining of the process. ConceptDraw DIAGRAM flowchart software enhanced with Flowcharts solution helps effectively make Flowchart Design. Use of predesigned flowchart symbols and bright color palette offers a fresh view and favorably distinguishes the flowcharts designed in ConceptDraw DIAGRAM from the black and white flowcharts on a paper. Preferably to use no more than three or four colors and apply identical for the same shape types. The best flowchart design can be achieved by starting with Flowchart template, or any of suitable ready examples or samples offered in ConceptDraw STORE, open one of them and enter the proper text into each Flowchart shape. Each symbol of the flowchart has a definition that can't be changed. This means that all flowcharts shapes can be grouped in according to their meaning. Users with ConceptDraw DIAGRAM flowchart software can style groups of symbols with close definitions by color sets chosen from complementary palette. Almost all workflows can be depicted as a flowchart. Colored diagrams are more light for perception of the certain information, this is part of flowchart design. Bright colors need to be used in the key points of Decision symbols, to focus attention on their importance for whole process flow.
Business Process Modeling with ConceptDraw
Business Process Modeling with ConceptDraw "Business Process Diagrams" Solution

ConceptDraw MINDMAP : Brainstorming, Mind Mapping for macOS and Windows

ConceptDraw MINDMAP is a powerful business and personal productivity software application that provides visual organization and access to information for individuals and organizations.