This site uses cookies. By continuing to browse the ConceptDraw site you are agreeing to our Use of Site Cookies.

Business process Flow Chart — Event-Driven Process chain (EPC) diagrams

Event-Driven Process chain Diagrams for improvement throughout an organisation. Best software for Process Flow Diagram. The Event-driven Process Chain (EPC) Diagrams allows managers to plan processes and resources.

Process Flow Diagram

A Process Flow Diagram (PFD) is a diagram which shows the relationships between the main components in a system. Process Flow Diagrams are widely used by engineers in chemical and process engineering, they allows to indicate the general flow of plant process streams and equipment, helps to design the petroleum refineries, petrochemical and chemical plants, natural gas processing plants, and many other industrial facilities.
ConceptDraw DIAGRAM diagramming and vector drawing software extended with powerful tools of Flowcharts Solution from the "Diagrams" Area of ConceptDraw Solution Park is effective for drawing: Process Flow Diagram, Flow Process Diagram, Business Process Flow Diagrams.

Process Flowchart

ConceptDraw is Professional business process mapping software for making process flow diagram, workflow diagram, general flowcharts and technical illustrations for business documents. It is includes rich examples, templates, process flowchart symbols. ConceptDraw flowchart maker allows you to easier create a process flowchart. Use a variety of drawing tools, smart connectors, flowchart symbols and shape libraries to create flowcharts of complex processes, process flow diagrams, procedures and information exchange.
How To Create a Process Flow Chart (business process modelling techniques)

Flowchart Components

The ConceptDraw Flowchart component includes a set of samples and templates. This geathered as flowchart maker toolbox which focused on drawing flowcharts of any industry standards.

Basic Flowchart Symbols and Meaning

Flowchart Symbols and Meaning - Provides a visual representation of basic flowchart symbols and their proposed use in professional workflow diagram, standard process flow diagram and communicating the structure of a well-developed web site, as well as their correlation in developing on-line instructional projects. See flowchart's symbols by specifics of process flow diagram symbols and workflow diagram symbols.
How to Build a Flowchart

Functional Flow Block Diagram

You need to draw a Functional Flow Block Diagram? You are an artist? Now it doesn't matter. With Block Diagrams solution from the "Diagrams" area for ConceptDraw Solution Park you don't need more to be an artist to design the Functional Flow Block Diagram of any complexity.
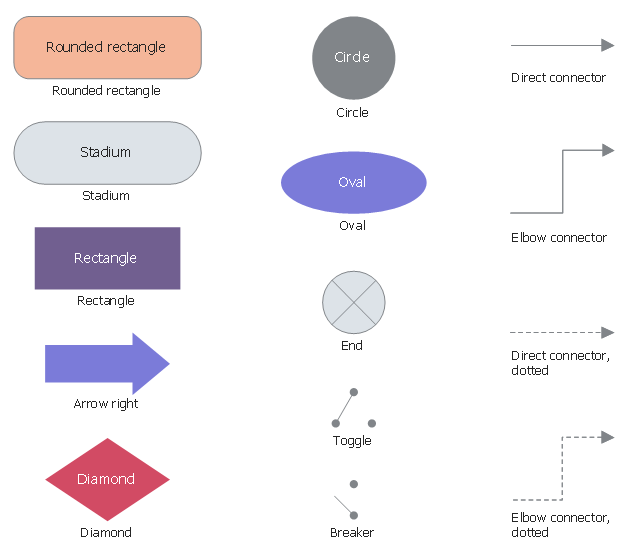
The vector stencils library "Control flow diagram" contains 14 CFD notation symbols.
Use it to draw your control flow diagrams with ConceptDraw PRO software.
The CFD symbols example "Design elements - Control flow diagram" is included in Сlassic Business Process Modeling solution from Business Processes area of ConceptDraw Solution Park.
Vector stencils
Vector stencils, toggle, control flow diagram, stadium, control flow diagram, rounded rectangle, control flow diagram, rectangle, control flow diagram, oval, control flow diagram, end, control flow diagram, elbow connector dotted, elbow connector, direct connector dotted, direct connector, diamond, control flow diagram, circle, control flow diagram, breaker, control flow diagram, arrow right, control flow diagram,

Process Flow Chart

A Process Flow Chart is a type of flowchart which is mostly used in industrial, chemical and process engineering for illustrating high-level processes, major plant processes and not shows minor details.
ConceptDraw DIAGRAM diagramming and vector drawing software extended with Flowcharts Solution from the "Diagrams" Area of ConceptDraw Solution Park is the best way to create Process Flow Chart and other types of flowcharts.

Quality Control Chart Software — ISO Flowcharting

Quality Control Chart Software (ISO Flowcharting) - ConceptDraw DIAGRAM extended with Total Quality Management TQM Diagrams Solution from the Quality Management Area is the best diagramming and vector drawing software that allows you to draw the quality control charts quick and easy.
The quality control chart is a graphic that illustrates the accordance of processes or products to the intended specifications and degree of differences from them. Depending on what type of data you need analyze, there are used different types of quality control charts: X-bar charts, S charts, Np charts.

Data Flow Diagram

Data flow diagram (DFD) is the part of the SSADM method (Structured Systems Analysis and Design Methodology), intended for analysis and information systems projection. Data flow diagrams are intended for graphical representation of data flows in the information system and for analysis of data processing during the structural projection. Data flow diagram often used in connection with human process and can be displayed as workflow diagram. The critical Process Flow Diagram is another flowchart technique for designing data flow in connection with organizational processes. The critical Process flow diagram may use different range of symbols than a classic workflow diagram.