How to Create a Social Media DFD Flowchart
The use of social media in modern conditions helps the companies to be more effective in timely messaging - actively and rapidly response to a customer posts in social media, to find quickly the appropriate response to social media mentions, to save greatly the budget. Many companies even use the social media as a lead tool for promotion. But how to create a Social Media DFD Flowchart, Social Media Response Flowchart or Action Mind Map fast and easy? ConceptDraw PRO vector graphical software and Social Media Response solution included to ConceptDraw Solution Park assist greatly in their creation. This solution improves the quality of content in social media and helps to build an active customer community. The samples and examples included to Social Media Response solution are helpful for social media teams in developing a social media strategy, in refining and organizing the response process, in creation training materials by trainers and consultants for education the social media groups on how to accomplish the most effectiveness in their daily work.125 Ways to Integrate Social Media to Increase Your Business
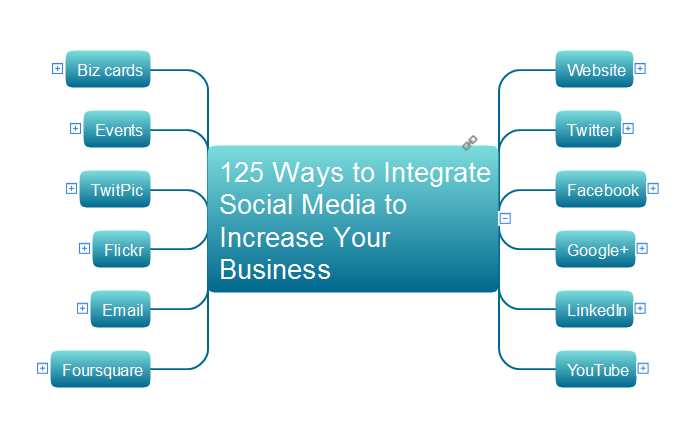
The social network services and social media are actively used in the modern business world to promote products and services to the market, and effectively communicate with customers. They are the most simple and effective way of setting the feedbacks, allow to organize effectively a dialogue with consumers, to provide for potential consumers the necessary information about a given product or service, and collect effortlessly the valuable reviews and opinions from the real customers. The social media allow you to read and analyze the information about different products, to compare them, to make the predictions about interesting products for particular categories of potential clients. This Mind Map designed in ConceptDraw MINDMAP illustrates 125 ways to integrate the social media to increase your business. The modern social media approaches to business marketing can be easy presented to others using the ConceptDraw MINDMAP application and the eLearning for Skype solution from ConceptDraw Solution Park.
 iPhone User Interface
iPhone User Interface solution extends ConceptDraw PRO v10 software with templates, samples and libraries with large quantity of vector stencils of graphical user interface elements, Apps icons, UI patterns for designing and prototyping of the iOS applic
 Website Wireframe
The innovative Website Wireframe solution enhances the ConceptDraw PRO v10 functionality with newest wireframe tools, libraries with variety of predesigned icons, symbols, buttons, graphics, forms, boxes, and many other vector elements, templates and professionally designed samples, which make it the best wireframing software. Website Wireframe solution gives you significant advantages when designing and maintaining websites, creating skeletal and content-free depictions of website structure, making website prototypes and planning the content arrangement before committing to design, also speeds up the processes of sketching, producing and sharing wireframe examples of website style and interface design.
Online Marketing Objectives
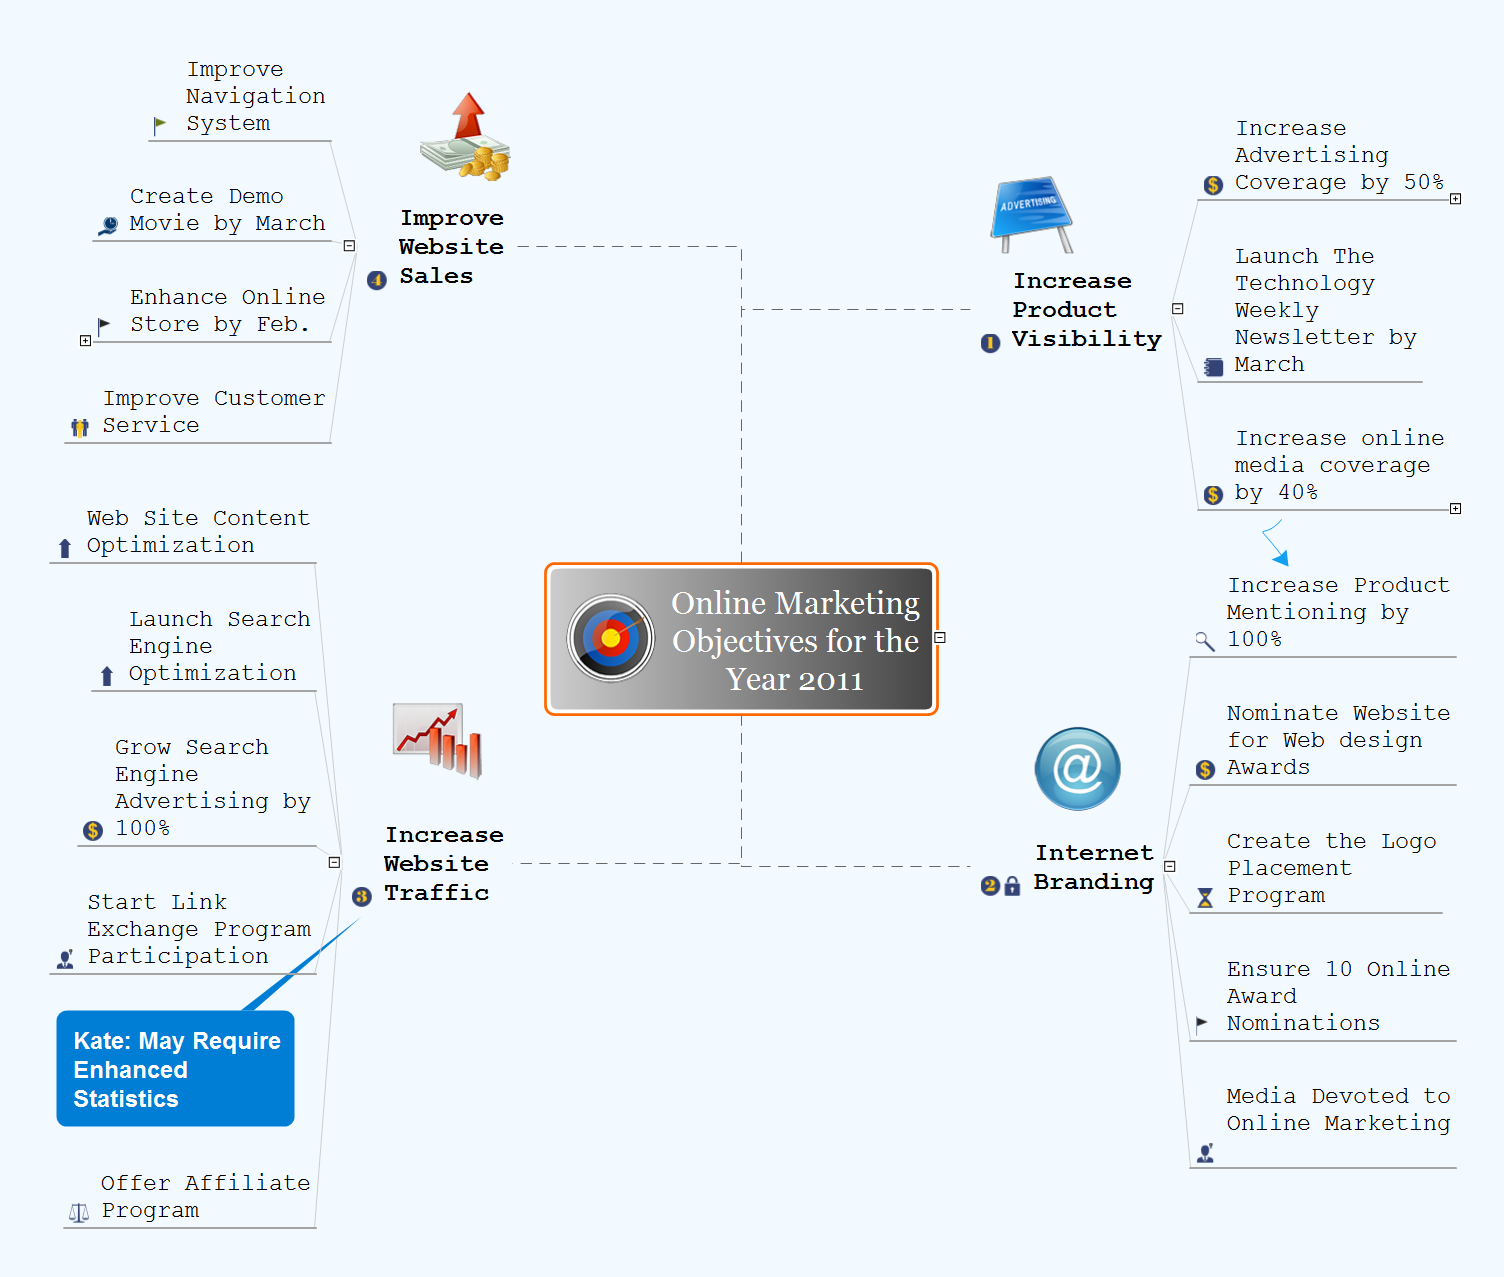
Promotion and sale of goods or services, as well as the conquest of free niche on the market in a given category include numerous methods directed on the advertising the products and attraction attention of potential buyers. Among them are traditional methods of struggle for the buyer, as well as internet marketing or online marketing, that is a complex of measures aimed at attraction of clients using the online technologies. The main tool of online marketing is a website of the company. The proper preparation and promotion of website ensure to the owner the opportunity to successfully compete with manufacturers of similar products, ensuring the high sales. Today each manufacturer, regardless of the size and direction of activities, creates a website, online store, blog, pages in social networks that give the visitors full information about the company, its products and services. Given the fact that a potential buyer spends a lot of time at the Internet, such strategy is justified and the practice shows a high efficiency of online marketing. ConceptDraw MINDMAP helps to illustrate a value of outline marketing on a Mind Map, to represent the online marketing objectives for a company and to specify the targets outlined for each of these objectives.Pyramid Diagram
The Time-Money-Quality Triangle illustrates an advertising truism, that you can't have all three.
 AWS Architecture Diagrams
AWS Architecture Diagrams with powerful drawing tools and numerous predesigned Amazon icons and AWS simple icons is the best for creation the AWS Architecture Diagrams, describing the use of Amazon Web Services or Amazon Cloud Services, their application for development and implementation the systems running on the AWS infrastructure. The multifarious samples give you the good understanding of AWS platform, its structure, services, resources and features, wide opportunities, advantages and benefits from their use; solution’s templates are essential and helpful when designing, description and implementing the AWS infrastructure-based systems. Use them in technical documentation, advertising and marketing materials, in specifications, presentation slides, whitepapers, datasheets, posters, etc.
Pyramid Diagram
The representation of data in a hierarchical or pyramid-like form is one of the most effective and illustrative ways of structuring the data, information, ideas in different fields, among them marketing, management, business, finances, sales, consulting, media, and some others. Pyramid Diagram perfectly suits for this goal, especially if we talk about the representing some marketing strategies, information systems, social strategies. Pyramid Diagram looks like a triangle or reversed triangle that is divided visually on several layers. Each layer can be colored with its own color, this lets visually highlight important moments. ConceptDraw PRO diagramming and vector graphics software extended with Pyramid Diagrams solution from the Marketing area provides powerful drawing tools, templates, samples, and built-in vector pyramid objects, thus all required tools for equally easy drawing Three level pyramid diagram, Four level pyramid model, Five level pyramid, etc., at this your Pyramid diagrams can have 2D or 3D view as you like.Process Flowchart
The main reason of using Process Flowchart or PFD is to show relations between major parts of the system. Process Flowcharts are used in process engineering and chemical industry where there is a requirement of depicting relationships between major components only and not include minor parts. Process Flowcharts for single unit or multiple units differ in their structure and implementation. ConceptDraw PRO is Professional business process mapping software for making Process flowcharts, Process flow diagram, Workflow diagram, flowcharts and technical illustrations for business documents and also comprehensive visio for mac application. Easier define and document basic work and data flows, financial, production and quality management processes to increase efficiency of your business with ConcepDraw PRO. Business process mapping software with Flowchart Maker ConceptDraw PRO includes extensive drawing tools, rich examples and templates, process flowchart symbols and shape libraries, smart connectors that allow you create the flowcharts of complex processes, process flow diagrams, procedures and information exchange. Process Flowchart Solution is project management workflow tools which is part ConceptDraw Project marketing project management software. Drawing charts, diagrams, and network layouts has long been the monopoly of Microsoft Visio, making Mac users to struggle when needing such visio alternative like visio for mac, it requires only to view features, make a minor edit to, or print a diagram or chart. Thankfully to MS Visio alternative like ConceptDraw PRO software, this is cross-platform charting and business process management tool, now visio alternative for making sort of visio diagram is not a problem anymore however many people still name it business process visio tools.
Onion Diagram Process Design
Onion diagram is a type of circular diagram that consists of the core circle representing the product/solution and concentric circles around it, which dependent on the core and look like the cross sections of onion. ConceptDraw PRO diagramming and vector drawing software supplied with Stakeholder Onion Diagrams Solution from the Management Area of ConceptDraw Solution Park is an ideal software for effective Onion diagram process design.
 Computer and Network Package
Computer and Network Package is a large set of valuable graphical solutions from ConceptDraw Solution Park, developed and specially selected to help computer network specialists and IT professionals to realize their daily work the most efficiently and quickly. This package contains extensive set of graphic design tools, ready-to-use vector elements, built-in templates and samples for designing professional-looking diagrams, charts, schematics and infographics in a field of computer network technologies, cloud computing, vehicular networking, wireless networking, ensuring networks security and networks protection. It is useful for designing different floor plans and layout plans for homes, offices, hotels and instantly construction detailed schemes of computer networks and wireless networks on them, for making professional-looking and colorful Pie Charts, Bar Graphs and Line Charts visualizing the relevant information and data.
 Android User Interface
The Android User Interface solution allows ConceptDraw PRO act as an Android UI design tool. Libraries and templates contain a variety of Android GUI elements to help users create images based on Android UI design.
 Active Directory Diagrams
Active Directory Diagrams solution significantly extends the capabilities of ConceptDraw PRO software with special Active Directory samples, convenient template and libraries of Active Directory vector stencils, common icons of sites and services, icons of LDPA elements, which were developed to help you in planning and modelling network structures and network topologies, in designing excellently looking Active Directory diagrams, Active Directory Structure diagrams, and Active Directory Services diagram, which are perfect way to visualize detailed structures of Microsoft Windows networks, Active Directory Domain topology, Active Directory Site topology, Organizational Units (OU), and Exchange Server organization.
Business Process Workflow Diagram
Business Process Workflow Diagram is a professional visual tool that is widely applied for business development, business analysis, business process optimization and documenting business processes. Business Process Workflow Diagram lets depict in details the steps of business processes and flow of tasks between them, the execution of business processes, transfer of data and documents. The workflows on the Business Process Workflow Diagram are represented using the set of common symbols which let easy illustrate business processes and process flows, depict the start, all major steps and end of the process, what data are used by the process, how the data flow through the business areas within scope of our project, how the tasks are executed and by who, and how workers interact with each other.
Pyramid Diagram
The DIKW Pyramid refers loosely to a class of models for representing purported structural and/or functional relationships between data, information, knowledge, and wisdom.- Advertising Agency Icon
- Conventional and wireless ad hoc network | Pyramid Diagram | Time ...
- Spam Icon Png
- Advertising Icon Png
- Online Advertising Icon Png
- Social Media Response | LDAP - Vector stencils library | Chemistry ...
- Social Media Response | AWS Security, Identity and Compliance ...
- Seo Vector Png
- Advertising Icon Vector Png
- Design elements - Advertising | Advertising - Vector stencils library ...
- Advertising Infographic Png
- Internet marketing professions | Green Banner Png
- Internet Banking Icon Png
- Hub And Spoke Icon Png
- Map With Ads
- Magazine Icon Logo Png
- Internet marketing professions | HR professions - Vector stencils ...
- Communication medium diagram | How to Create a Social Media ...
- Design elements - Advertisement | Step chart - Cloud testing steps ...
- Internet Circle Logo Blue Png


